Charts are an excellent tool for concisely showing data. Moreover, they represent the data visually, making it easier to consume large amounts of data. You might find charts to be helpful in situations where you need to show data such as the monthly budget comparison or product adoption rate. In light of that, this article will teach you how to create charts in Excel files using C++.
- C++ API for Creating Excel Charts
- Create Line Chart in Excel using C++
- Creating Pyramid Chart in Excel using C++
- Create Bubble Chart in Excel using C++
- Additional Supported Charts
- Get a Free License
C++ API for Creating Excel Charts
Aspose.Cells for C++ is a native C++ library that allows you to create, read and modify Excel files without requiring Microsoft Excel to be installed. The API also supports creating charts in Excel files. You can either install the API through NuGet or download it directly from the Downloads section.
PM> Install-Package Aspose.Cells.Cpp
Create Line Chart in Excel using C++
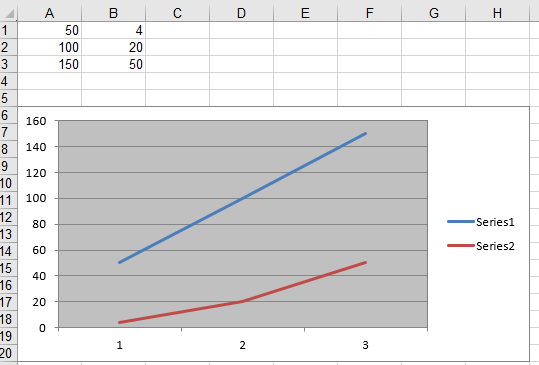
To create a line chart, use the ChartType_Line enum value while adding the chart. The following are the steps to create a line chart in an Excel file.
- Firstly, create an instance of the IWorkbook class.
- Retrieve the worksheet where you want to add the chart using the IWorkbook->GetIWorksheets()->GetObjectByIndex (Aspose::Cells::Systems::Int32 index) method.
- Insert the data for the chart.
- Add the chart to the worksheet using the IWorksheet->GetICharts()->Add (Aspose::Cells::Charts::ChartType type,Aspose::Cells::Systems::Int32 upperLeftRow, Aspose::Cells::Systems::Int32 upperLeftColumn, Aspose::Cells::Systems::Int32 lowerRightRow, Aspose::Cells::Systems::Int32 lowerRightColumn) method.
- Access the chart with its index using the IWorksheet->GetICharts()->GetObjectByIndex (Aspose::Cells::Systems::Int32 index) method.
- Add the data source for the chart using the IChart->GetNISeries()->Add (intrusive_ptrAspose::Cells::Systems::String area, bool isVertical) method.
- Finally, save the Excel file using the IWorkbook->Save (intrusive_ptrAspose::Cells::Systems::String fileName) method.
The following is the sample code to create a line chart in Excel using C++.

Line chart generated by the sample code
Creating Pyramid Chart in Excel using C++
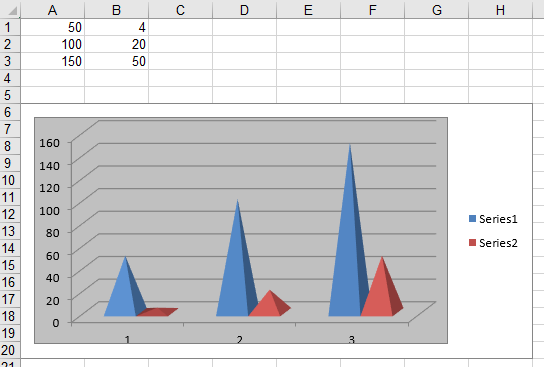
For creating a pyramid chart, use the ChartType_Pyramid enum value to specify the chart type while adding the chart. The following are the steps to create a pyramid chart in an Excel file.
- Firstly, create an instance of the IWorkbook class.
- Retrieve the worksheet where you want to add the chart using the IWorkbook->GetIWorksheets()->GetObjectByIndex (Aspose::Cells::Systems::Int32 index) method.
- Insert the data for the chart.
- Add the chart to the worksheet using the IWorksheet->GetICharts()->Add (Aspose::Cells::Charts::ChartType type,Aspose::Cells::Systems::Int32 upperLeftRow, Aspose::Cells::Systems::Int32 upperLeftColumn, Aspose::Cells::Systems::Int32 lowerRightRow, Aspose::Cells::Systems::Int32 lowerRightColumn) method.
- Access the chart with its index using the IWorksheet->GetICharts()->GetObjectByIndex (Aspose::Cells::Systems::Int32 index) method.
- Add the data source for the chart using the IChart->GetNISeries()->Add (intrusive_ptrAspose::Cells::Systems::String area, bool isVertical) method.
- Finally, save the Excel file using the IWorkbook->Save (intrusive_ptrAspose::Cells::Systems::String fileName) method.
The following is the sample code to create a pyramid chart in Excel using C++.

Pyramid chart generated by the sample code
Create Bubble Chart in Excel using C++
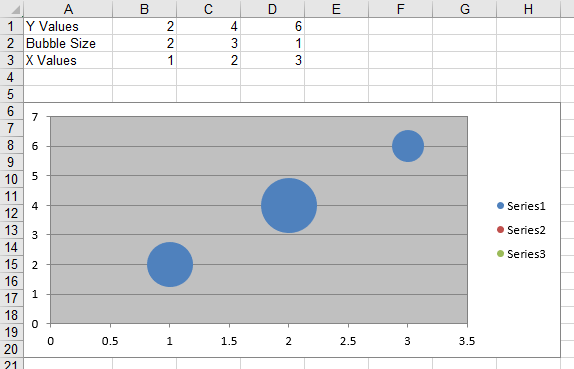
In order to create a bubble chart, pass the ChartType_Bubble enum value to the IWorksheet->GetICharts()->Add() method. The following are the steps to create a bubble chart in an Excel file.
- Firstly, create an instance of the IWorkbook class.
- Retrieve the worksheet where you want to add the chart using the IWorkbook->GetIWorksheets()->GetObjectByIndex (Aspose::Cells::Systems::Int32 index) method.
- Insert the data for the chart.
- Add the chart to the worksheet using the IWorksheet->GetICharts()->Add (Aspose::Cells::Charts::ChartType type,Aspose::Cells::Systems::Int32 upperLeftRow, Aspose::Cells::Systems::Int32 upperLeftColumn, Aspose::Cells::Systems::Int32 lowerRightRow, Aspose::Cells::Systems::Int32 lowerRightColumn) method.
- Access the chart with its index using the IWorksheet->GetICharts()->GetObjectByIndex (Aspose::Cells::Systems::Int32 index) method.
- Add the data source, bubble sizes, X values and Y values for the chart using the IChart->GetNISeries()->Add (intrusive_ptrAspose::Cells::Systems::String area, bool isVertical), IChart->GetNISeries()->GetObjectByIndex(0)->SetBubbleSizes (intrusive_ptrAspose::Cells::Systems::String value), IChart->GetNISeries()->GetObjectByIndex(0)->SetXValues (intrusive_ptrAspose::Cells::Systems::String value), IChart->GetNISeries()->GetObjectByIndex(0)->SetValues (intrusive_ptrAspose::Cells::Systems::String value) methods respectively.
- Finally, save the Excel file using the IWorkbook->Save (intrusive_ptrAspose::Cells::Systems::String fileName) method.
The following is the sample code to create a bubble chart in Excel using C++.

Bubble chart generated by the sample code
Additional Supported Charts
Other than the charts shown above, Aspose.Cells for C++ supports many additional chart types. You can view the complete list of supported charts by viewing the ChartType enum values.
Get a Free License
You can try the API without evaluation limitations by requesting a free temporary license.
Conclusion
In this article, you have learned how to create charts in Excel spreadsheets using C++. Specifically, you have seen how to create Line, Pyramid, and Bubble charts using Aspose.Cells for C++ API. Furthermore, you have seen that the API supports a large number of other charts that you can create in your Excel files. Besides charts, the API provides many additional features for working with Excel files. You can explore the API in detail by visiting the official documentation. In case of any questions, please feel free to reach us on our free support forum.