
MS PowerPointは、チャート、グラフィックス、アニメーション、およびその他の要素を使用してインタラクティブなプレゼンテーションを作成できる機能豊富なアプリケーションです。プログラマーとして、Pythonアプリケーション内からPowerPointのプレゼンテーション操作機能を自動化する必要があるかもしれません。この投稿では、PythonでPowerPointPPTまたはPPTXプレゼンテーションを作成する方法を学習します。さらに、プログラムでプレゼンテーションにスライド、テキスト、表、画像、およびグラフを追加する方法についても説明します。
- PowerPointPPTを作成するためのPythonライブラリ
- PowerPointPPTを作成する
- 既存のプレゼンテーションを開く
- プレゼンテーションにスライドを追加する
- プレゼンテーションにテキストを追加する
- プレゼンテーションでテーブルを作成する
- プレゼンテーションでグラフを作成する
- プレゼンテーションに画像を追加する
PowerPointPPTを作成するためのPythonライブラリ
Aspose.Slides for Python via .NETは、MSOfficeなしでPowerPointPPT/PPTXを作成および操作できる強力なPythonライブラリです。さらに、既存のプレゼンテーションを更新して、他の形式に変換することができます。次のpipコマンドを使用して、PyPIからライブラリをインストールできます。
> pip install aspose.slides
PythonでPowerPointPPTを作成する
まず、デフォルトで追加されている空のスライドを持つPowerPointプレゼンテーションを作成しましょう。次の手順は、PythonでPowerPointPPTを作成する方法を示しています。
- まず、Presentationクラスのインスタンスを作成します。
- 次に、**Presentation.save(string, export.SaveFormat)**メソッドを使用してPPTを保存します。
次のコードサンプルは、PythonでPowerPoint PPTXファイルを作成する方法を示しています。
import aspose.slides as slides

# Create a new presentation
with slides.Presentation() as presentation:

    # Access the default slide
    slide = presentation.slides[0]

    # Save the presentation
    presentation.save("create-presentation.pptx", slides.export.SaveFormat.PPTX)
PythonでPowerPoint PPTXファイルを開く
既存のプレゼンテーションを開いて、そのコンテンツを更新することもできます。これを実現するには、Presentationコンストラクターでプレゼンテーションファイルのパスを指定するだけで済みます。次のコードサンプルは、Pythonで既存のPPT/PPTXファイルを開く方法を示しています。
import aspose.slides as slides

# Open presentation
with slides.Presentation("presentation.ppt") as presentation:

    # Access the default slide
    slide = presentation.slides[0]

    # Save the presentation
    presentation.save("create-presentation.ppt", slides.export.SaveFormat.PPT)
PythonでPowerPointPPTにスライドを追加する
以前に作成したプレゼンテーションに新しいスライドを追加しましょう。最初にプレゼンテーションを開くことで、同じ方法で既存のプレゼンテーションにスライドを追加することもできます(前のセクションに示されているように)。以下は、PythonのPPT/PPTXプレゼンテーションにスライドを追加する手順です。
- まず、Presentationクラスを使用して新しい(または既存のロード)プレゼンテーションを作成します。
- 次に、Presentation.slidesプロパティを使用してスライドコレクションの参照を取得します。
- **Presentation.slides.add_empty_slide(LayoutSlide)**メソッドを使用してスライドを追加します。
- 最後に、**Presentation.save(string, export.SaveFormat)**メソッドを使用してプレゼンテーションを保存します。
次のコードサンプルは、PythonでPowerPointプレゼンテーションにスライドを追加する方法を示しています。
import aspose.slides as slides

# Create a new presentation
with slides.Presentation() as pres:
    # Get reference of slides
    slds = pres.slides

    # Loop through layout slides
    for i in range(len(pres.layout_slides)):
        # Add an empty slide to the slides collection
        slds.add_empty_slide(pres.layout_slides[i])

    # Do some work on the newly added slide

    # Save the PPTX file to the Disk
    pres.save("presentation.pptx", slides.export.SaveFormat.PPTX)
PythonでPowerPointPPTにテキストを追加する
スライドを追加したら、コンテンツの追加に進むことができます。まず、Pythonでプレゼンテーションスライドにテキストを追加する方法を見てみましょう。
- Presentationクラスを使用して、新しい(または既存の)PPT/PPTXを作成します。
- Presentation.slidesコレクションからスライドの参照を取得します。
- **Slide.shapes.add_auto_shape(slides.ShapeType.RECTANGLE, int, int, int, int)**メソッドを使用してスライドに新しい自動形状を追加し、オブジェクト内の形状の参照を取得します。
- **add_text_frame(string)**メソッドを使用して、図形にテキストフレームを追加します。
- テキストフレームのデフォルトの段落にアクセスします。
- 段落のデフォルト部分にアクセスします。
- 部分にテキストを追加し、**Presentation.save(string, export.SaveFormat)**メソッドを使用してプレゼンテーションを保存します。
次のコードサンプルは、Pythonを使用してPPTのスライドにテキストを追加する方法を示しています。
import aspose.slides as slides
# Create presentation
with slides.Presentation() as pres:
# Access first slide
slide = pres.slides[0]
# Add an AutoShape with type set as Rectangle
ashp = slide.shapes.add_auto_shape(slides.ShapeType.RECTANGLE, 150, 75, 150, 50)
# Add TextFrame to the Rectangle
ashp.add_text_frame(" ")
# Access the text frame
txtFrame = ashp.text_frame
# Create the Paragraph object for text frame
para = txtFrame.paragraphs[0]
# Create a Portion object for paragraph
portion = para.portions[0]
# Set text
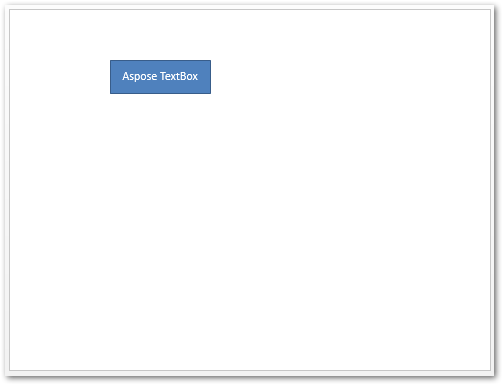
portion.text = "Aspose TextBox"
# Save the presentation
pres.save("add-text-in-presentation.pptx", slides.export.SaveFormat.PPTX)
以下は、テキストを追加した後のスライドのスクリーンショットです。
続きを読むPowerPointプレゼンテーションでのテキストの操作について。
PythonでPowerPointPPTにテーブルを作成する
表はドキュメントの不可欠な部分であり、PowerPointプレゼンテーションでも広く使用されています。 Aspose.Slides for Pythonを使用すると、プレゼンテーションでテーブルを簡単に作成できます。それでは、Pythonを使用してPPTでテーブルを作成する方法を見てみましょう。
- Presentationクラスを使用して、新しい(または既存の)PPT/PPTXを作成します。
- Presentation.slidesコレクションからスライドの参照を取得します。
- 幅のある列と高さのある行の配列を定義します。
- **Slide.shapes.addTable()**を使用してテーブルを作成し、オブジェクト内のテーブルの参照を取得します。
- セルをループして、書式を適用します。
- Table.rows[][].text_frame.textプロパティを使用してセルにテキストを追加します。
- **Presentation.save(string, export.SaveFormat)**メソッドを使用してプレゼンテーションを保存します。
次のコードサンプルは、Pythonを使用してPowerPointプレゼンテーションでテーブルを作成する方法を示しています。
import aspose.slides as slides
import aspose.pydrawing as drawing
# Create presentation
with slides.Presentation() as pres:
# Access first slide
slide = pres.slides[0]
# Define columns with widths and rows with heights
dblCols = [50, 50, 50]
dblRows = [50, 30, 30, 30, 30]
# Add table shape to slide
tbl = slide.shapes.add_table(100, 50, dblCols, dblRows)
# Set border format for each cell
for row in range(len(tbl.rows)):
for cell in range(len(tbl.rows[row])):
tbl.rows[row][cell].cell_format.border_top.fill_format.fill_type = slides.FillType.SOLID
tbl.rows[row][cell].cell_format.border_top.fill_format.solid_fill_color.color = drawing.Color.blue
tbl.rows[row][cell].cell_format.border_top.width = 5
tbl.rows[row][cell].cell_format.border_bottom.fill_format.fill_type = slides.FillType.SOLID
tbl.rows[row][cell].cell_format.border_bottom.fill_format.solid_fill_color.color= drawing.Color.blue
tbl.rows[row][cell].cell_format.border_bottom.width =5
tbl.rows[row][cell].cell_format.border_left.fill_format.fill_type = slides.FillType.SOLID
tbl.rows[row][cell].cell_format.border_left.fill_format.solid_fill_color.color =drawing.Color.blue
tbl.rows[row][cell].cell_format.border_left.width = 5
tbl.rows[row][cell].cell_format.border_right.fill_format.fill_type = slides.FillType.SOLID
tbl.rows[row][cell].cell_format.border_right.fill_format.solid_fill_color.color = drawing.Color.blue
tbl.rows[row][cell].cell_format.border_right.width = 5
# Merge cells 1 & 2 of row 1
tbl.merge_cells(tbl.rows[0][0], tbl.rows[1][1], False)
# Add text to the merged cell
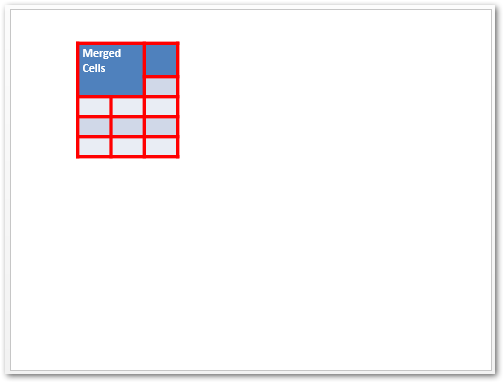
tbl.rows[0][0].text_frame.text = "Merged Cells"
# Save the presentation
pres.save("add-table-in-presentation.pptx", slides.export.SaveFormat.PPTX)
以下は、上記のコードスニペットの出力です。
テーブルの作成と操作の他の機能を調べてください。
PythonでPowerPointPPTにグラフを作成する
以下は、PythonのPowerPointプレゼンテーションにグラフを追加する手順です。
- Presentationクラスを使用して、新しい(または既存の)プレゼンテーションを作成します。
- Presentation.slidesコレクションからスライドの参照を取得します。
- **Slide.shapes.addChart(ChartType, single, single, single, single)**メソッドを使用して、目的のタイプのグラフを追加します。
- チャートデータワークシートにアクセスします。
- デフォルトのシリーズとカテゴリをすべてクリアします。
- 新しいシリーズとカテゴリを追加します。
- チャートシリーズの新しいチャートデータを追加します。
- チャートシリーズの塗りつぶし色を設定します。
- チャートシリーズのラベルを追加します。
- プレゼンテーションをPPTXファイルとして保存します。
次のコードサンプルは、Pythonを使用してPPTにグラフを追加する方法を示しています。
import aspose.slides as slides
import aspose.pydrawing as drawing

# Create presentation
with slides.Presentation() as pres:
    # Access first slide
    slide = pres.slides[0]

    # Access first slide
    sld = pres.slides[0]

    # Add chart with default data
    chart = sld.shapes.add_chart(slides.charts.ChartType.CLUSTERED_COLUMN, 0, 0, 500, 500)

    # Set chart Title
    chart.chart_title.add_text_frame_for_overriding("Sample Title")
    chart.chart_title.text_frame_for_overriding.text_frame_format.center_text = 1
    chart.chart_title.height = 20
    chart.has_title = True

    # Set first series to Show Values
    chart.chart_data.series[0].labels.default_data_label_format.show_value = True

    # Set the index of chart data sheet
    defaultWorksheetIndex = 0

    # Get the chart data worksheet
    fact = chart.chart_data.chart_data_workbook

    # Delete default generated series and categories
    chart.chart_data.series.clear()
    chart.chart_data.categories.clear()
    s = len(chart.chart_data.series)
    s = len(chart.chart_data.categories)

    # Add new series
    chart.chart_data.series.add(fact.get_cell(defaultWorksheetIndex, 0, 1, "Series 1"), chart.type)
    chart.chart_data.series.add(fact.get_cell(defaultWorksheetIndex, 0, 2, "Series 2"), chart.type)

    # Add new categories
    chart.chart_data.categories.add(fact.get_cell(defaultWorksheetIndex, 1, 0, "Caetegoty 1"))
    chart.chart_data.categories.add(fact.get_cell(defaultWorksheetIndex, 2, 0, "Caetegoty 2"))
    chart.chart_data.categories.add(fact.get_cell(defaultWorksheetIndex, 3, 0, "Caetegoty 3"))

    # Take first chart series
    series = chart.chart_data.series[0]

    # Now populating series data

    series.data_points.add_data_point_for_bar_series(fact.get_cell(defaultWorksheetIndex, 1, 1, 20))
    series.data_points.add_data_point_for_bar_series(fact.get_cell(defaultWorksheetIndex, 2, 1, 50))
    series.data_points.add_data_point_for_bar_series(fact.get_cell(defaultWorksheetIndex, 3, 1, 30))

    # Set fill color for series
    series.format.fill.fill_type = slides.FillType.SOLID
    series.format.fill.solid_fill_color.color = drawing.Color.red

    # Take second chart series
    series = chart.chart_data.series[1]

    # Now populating series data
    series.data_points.add_data_point_for_bar_series(fact.get_cell(defaultWorksheetIndex, 1, 2, 30))
    series.data_points.add_data_point_for_bar_series(fact.get_cell(defaultWorksheetIndex, 2, 2, 10))
    series.data_points.add_data_point_for_bar_series(fact.get_cell(defaultWorksheetIndex, 3, 2, 60))

    # Setting fill color for series
    series.format.fill.fill_type = slides.FillType.SOLID
    series.format.fill.solid_fill_color.color = drawing.Color.orange

    # First label will be show Category name
    lbl = series.data_points[0].label
    lbl.data_label_format.show_category_name = True

    lbl = series.data_points[1].label
    lbl.data_label_format.show_series_name = True

    # Show value for third label
    lbl = series.data_points[2].label
    lbl.data_label_format.show_value = True
    lbl.data_label_format.show_series_name = True
    lbl.data_label_format.separator = "/"

    # Save the presentation
    pres.save("create-chart-in-presentation.pptx", slides.export.SaveFormat.PPTX)
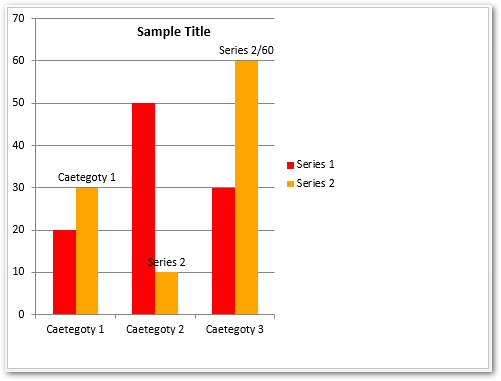
次のスクリーンショットは、上記のコードスニペットを使用して作成したグラフを示しています。
詳細PowerPointプレゼンテーションでのグラフの作成について。
PythonのPowerPoint PPTXに画像を追加する
以下は、PythonでPowerPoint PPTXに画像を追加する手順です。
- Presentationクラスを使用して、新しい(または既存の)プレゼンテーションを作成します。
- Presentation.slidesコレクションからスライドの参照を取得します。
- **open(string, string)**メソッドを使用してファイルから画像を開きます。
- **Presentation.images.add_image()**メソッドを使用して、プレゼンテーションの画像コレクションに画像を追加します。
- **Slide.shapes.add_picture_frame()**メソッドを使用してスライドに画像を追加します。
- **Presentation.save(string, export.SaveFormat)**メソッドを使用してプレゼンテーションを保存します。
次のコードサンプルは、PythonでPowerPointプレゼンテーションに画像を追加する方法を示しています。
import aspose.slides as slides

# Create presentation
with slides.Presentation() as pres:
    # Access first slide
    slide = pres.slides[0]

    # Load image from file
    with open("python-logo.png", "rb") as in_file:

        # Add image to presentation's image collection
        image = pres.images.add_image(in_file)

        # Add image to slide
        slide.shapes.add_picture_frame(slides.ShapeType.RECTANGLE, 10, 10, 100, 100, image)

    # Save the presentation
    pres.save("add-image-in-presentation.pptx", slides.export.SaveFormat.PPTX)
以下は、上記のコードサンプルの出力です。

PowerPointプレゼンテーションの画像の操作の詳細をご覧ください。
無料ライセンスを取得する
一時ライセンスを取得することで、評価の制限なしに.NET経由でAspose.Slides for Pythonを使用できます。
結論
この記事では、PythonでPowerPoint PPT/PPTXを最初から作成する方法を学びました。 PowerPointプレゼンテーションにスライド、テキスト、表、グラフ、および画像を追加する方法を示しました。さらに、ドキュメントを使用して、Python用のAspose.Slidesの他の機能を調べることができます。また、フォーラムを介してお気軽にご質問をお寄せください。