
Charts are used to summarize and visually represent the data within the PowerPoint presentations. Therefore, PowerPoint provides a wide range of chart types to visualize the data. Among all, the most commonly used chart types include pie charts, line charts, bar charts, histograms, stock charts, and etc. In this article, you will learn how to create these charts in PowerPoint presentations using C#.
- C# API to Create Charts in PowerPoint
- Create Column Chart in PowerPoint using C#
- Create Scatter Chart in PowerPoint using C#
- Add Pie Chart in PowerPoint using C#
- Add Histogram Chart in PowerPoint using C#
- Create a Stock Chart in PowerPoint using C#
- Get Free API License
C# API to Create Charts in PowerPoint
Aspose.Slides for .NET is a C# class library that lets you create and manipulate PowerPoint presentations from within .NET applications. Furthermore, the API allows you to create and add charts to the presentations seamlessly. Aspose.Slides for .NET can be downloaded as DLL or installed via NuGet.
PM> Install-Package Aspose.Slides
Create Column Chart in PowerPoint PPT using C#
In this section, you will learn how to create a column chart and add categories and series to populate that chart. The following are the steps to perform this operation.
- First, create an instance of the Presentation class.
- Get the reference of the slide in the ISlide object.
- Add a ClusteredColumn chart with default data and get its reference in IChart object.
- Set chart title using IChart.ChartTitle.AddTextFrameForOverriding(String) method and set its properties.
- Access the chart data workbook into the IChartDataWorkbook object.
- Clear all the default series and categories from chart data using IChart.ChartData.Series.Clear() and IChart.ChartData.Categories.Clear() methods respectively.
- Add new series and categories.
- Access each chart series into the IChartSeries object and add data points to it.
- Add fill color for chart series and set labels.
- Finally, save the presentation using Presentation.Save(String, SaveFormat) method.
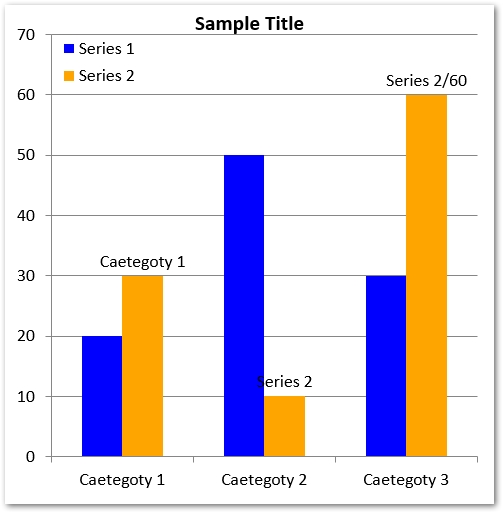
For demonstration, the following code sample shows how to create a column chart in PowerPoint presentation using C#.
The following is the screenshot of the resultant column chart.
Create Scatter Chart in PowerPoint PPT using C#
The following are the steps to create a scatter chart in the PowerPoint presentation using C#.
- Create a new presentation using the Presentation class.
- Get the reference of the slides in the ISlide object.
- Add a ScatterWithSmoothLines chart type with default data and get its reference in IChart object.
- Access the chart data workbook into the IChartDataWorkbook object and clear the default series.
- Add new series to the chart data.
- Access each series into the IChartSeries object and add data points to the series.
- Set the marker for the series using IChartSeries.Marker property.
- Save the presentation using Presentation.Save(String, SaveFormat) method.
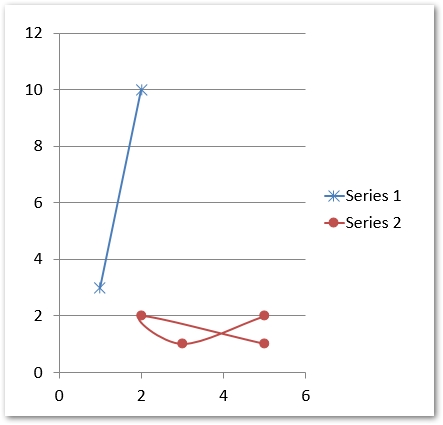
The following code sample shows how to create a scatter chart in PowerPoint presentations using C#.
The following screenshot shows the resultant scatter chart.
Create Pie Chart in PowerPoint PPT using C#
The following are the steps to create a pie chart in a PowerPoint presentation using C#.
- Create a new presentation using the Presentation class.
- Get the reference of the slides in the ISlide object.
- Add a Pie chart type with default data and get its reference in IChart object.
- Set chart title using IChart.ChartTitle.AddTextFrameForOverriding(String) method and set its properties.
- Set visibility of the values.
- Clear the default series and categories using using IChart.ChartData.Series.Clear() and IChart.ChartData.Categories.Clear() methods respectively.
- Access the chart data workbook into the IChartDataWorkbook object.
- Add new categories to the chart data into IChart.ChartData.Categories collection.
- Add new series to the chart data into IChart.ChartData.Series collection.
- Obtain each series into the IChartSeries object and add data points to the series.
- Access each data point into IChartDataPoint object and set its formatting.
- Access data labels in the data points using IDataLabel object and set their formatting.
- Set leader lines and rotation angles.
- Save the presentation using Presentation.Save(String, SaveFormat) method.
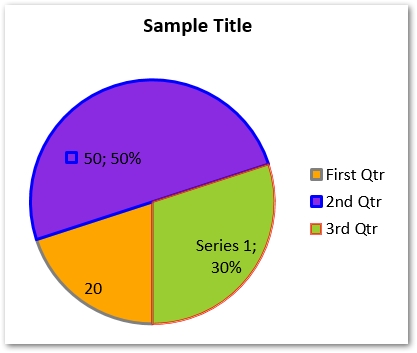
The following code sample shows how to create a pie chart in PowerPoint presentation using C#.
The following is the screenshot of the generated pie chart.
Add Histogram Chart in PowerPoint PPTX using C#
The following are the steps to create a histogram chart in PowerPoint presentations using Aspose.Slides for .NET.
- Create an instance of the Presentation class.
- Obtain a slide’s reference in the ISlide object by its index.
- Add a Histogram chart with default data.
- Clear the default series and categories.
- Access the chart data workbook in the IChartDataWorkbook object.
- Add new series and get its reference in the IChartSeries object.
- Add data points to the series.
- Set aggregation type of the chart axis.
- Save the presentation using Presentation.Save(String, SaveFormat) method.
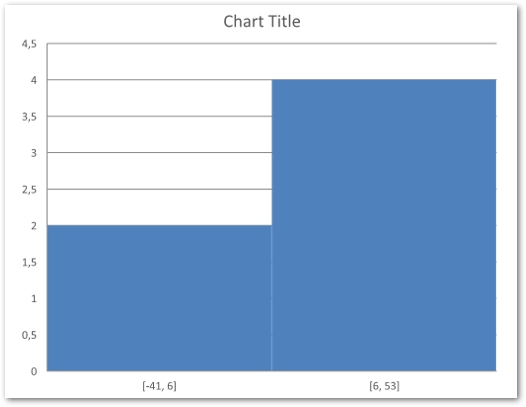
The following code sample shows how to create a histogram chart using C#.
The following is the screenshot of the created histogram chart.
Create a Stock Chart in PowerPoint using C#
Stock chart is also one of the commonly used chart types within PowerPoint presentations. The following are the steps to create a stock chart.
- Create a new PowerPoint presentation using Presentation class.
- Obtain slide’s reference in an ISlide object using the slide’s index.
- Add OpenHighLowClose chart to the slide and get its reference in the IChart object.
- Clear the default series and categories.
- Access the chart data in IChartDataWorkbook object.
- Add new series and categories to the chart.
- Access each chart series and add data points.
- Specify HiLowLines format.
- Save the presentation using Presentation.Save(String, SaveFormat) method.
The following code sample shows how to add a stock chart to PowerPoint presentation using C#.
The following is the screenshot of the created stock chart.

More Chart Types
In addition to the above-mentioned charts, there are other types of charts as well that you can add to the PowerPoint presentations. In order to read more about the supported chart types, you can visit this documentation article.
Get a Free API License
You can get a free temporary license in order to try the API without evaluation limitations.
Conclusion
In this article, you have learned how to create charts in PowerPoint presentations using C#. Furthermore, the step-by-step guide and code samples have shown how to add column charts, scatter charts, pie charts, histograms, and stock charts. You can explore more about Aspose.Slides for .NET using documentation.