
Biểu đồ là một công cụ tuyệt vời để hiển thị dữ liệu một cách chính xác. Hơn nữa, chúng làm cho việc tiêu thụ một lượng lớn dữ liệu dễ dàng hơn bằng cách thể hiện nó một cách trực quan. Thêm biểu đồ vào bản trình bày của bạn có thể hữu ích khi trình bày dữ liệu như xu hướng tăng trưởng của công ty hoặc tỷ lệ chấp nhận sản phẩm. Để kết thúc, bài viết này sẽ hướng dẫn bạn cách tạo biểu đồ trong bản trình bày PowerPoint bằng C ++.
- API C ++ để tạo biểu đồ trong bản trình bày PowerPoint
- Tạo biểu đồ cột trong bản trình bày PowerPoint bằng C ++
- Tạo biểu đồ hình tròn trong bản trình bày PowerPoint bằng C ++
- Tạo biểu đồ phân tán trong bản trình bày PowerPoint bằng C ++
- Tạo Biểu đồ Histogram trong Bản trình bày PowerPoint
- Biểu đồ được hỗ trợ bổ sung
- Nhận giấy phép miễn phí
API C ++ để tạo biểu đồ trong bản trình bày PowerPoint
Aspose.Slides for C ++ là một thư viện C ++ gốc hỗ trợ tạo, đọc và thao tác các tệp PowerPoint. API cũng hỗ trợ tạo biểu đồ trong bản trình bày PowerPoint. Bạn có thể cài đặt API thông qua NuGet hoặc tải xuống trực tiếp từ phần Tải xuống.
PM> Install-Package Aspose.Slides.Cpp
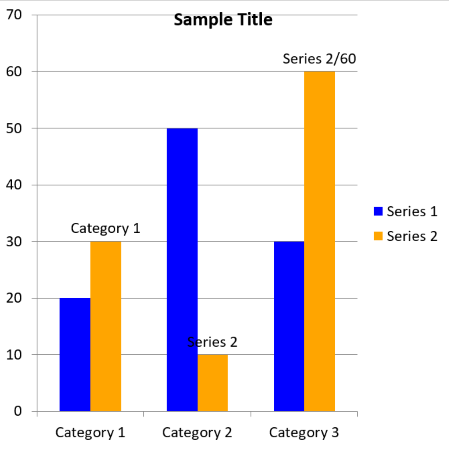
Tạo biểu đồ cột trong bản trình bày PowerPoint bằng C ++
Sau đây là các bước để tạo biểu đồ cột trong bản trình bày PowerPoint.
- Đầu tiên, tạo một thể hiện của lớp Presentation.
- Truy cập trang chiếu mà bạn muốn thêm biểu đồ cột bằng cách sử dụng Presentation-> getSlides() -> idxget (int32t index).
- Thêm biểu đồ ClusteredColumn vào trang chiếu bằng phương pháp ISlide-> getShapes() -> AddChart (Charts :: ChartType type, float x, float y, float width, float height).
- Truy cập sổ làm việc dữ liệu biểu đồ bằng phương pháp IChart-> getChartData() -> getChartDataWorkbook().
- Đặt tiêu đề của biểu đồ bằng phương thức IChart-> getChartTitle() -> AddTextFrameForOverriding (System :: String text).
- Xóa chuỗi và danh mục mặc định khỏi dữ liệu biểu đồ bằng cách sử dụng IChart-> getChartData() -> getSeries() -> Clear() và IChart-> getChartData() -> getCategories() -> Clear() phương pháp tương ứng.
- Thêm chuỗi và danh mục mới bằng cách sử dụng IChart-> getChartData() -> getSeries() -> Thêm (System :: SharedPtr cellWithSeriesName, ChartType type) và IChart-> getChartData() -> getCategories() -> Thêm (System :: SharedPtr chartDataCell) phương thức tương ứng.
- Truy cập từng chuỗi bằng phương thức IChart-> getChartData() -> getSeries() -> idxget (int32t index).
- Thêm các điểm dữ liệu, màu tô và nhãn cho từng chuỗi.
- Cuối cùng, lưu bản trình bày có chứa biểu đồ cột bằng phương pháp Presentation-> Save (System :: String name, Export :: SaveFormat format).
Sau đây là mã mẫu để thêm biểu đồ cột trong Bản trình bày PowerPoint bằng C ++.
// Đường dẫn tệp đầu ra.
const String outputFilePath = u"OutputDirectory\\column_chart.pptx";

// Khởi tạo lớp Trình bày đại diện cho tệp PPTX
SharedPtr<Presentation> pres = MakeObject<Presentation>();

// Truy cập trang trình bày đầu tiên
SharedPtr<ISlide> slide = pres->get_Slides()->idx_get(0);

// Thêm biểu đồ với dữ liệu mặc định
SharedPtr<IChart> chart = slide->get_Shapes()->AddChart(Aspose::Slides::Charts::ChartType::ClusteredColumn, 0, 0, 500, 500);

// Đặt chỉ mục của bảng dữ liệu biểu đồ
int defaultWorksheetIndex = 0;

// Lấy sổ làm việc dữ liệu biểu đồ
SharedPtr<IChartDataWorkbook> fact = chart->get_ChartData()->get_ChartDataWorkbook();

// Đặt tiêu đề biểu đồ
chart->get_ChartTitle()->AddTextFrameForOverriding(u"Sample Title");
chart->get_ChartTitle()->get_TextFrameForOverriding()->get_TextFrameFormat()->set_CenterText(NullableBool::True);
chart->get_ChartTitle()->set_Height(20);
chart->set_HasTitle(true);

// Xóa chuỗi và danh mục được tạo mặc định
chart->get_ChartData()->get_Series()->Clear();
chart->get_ChartData()->get_Categories()->Clear();
int s = chart->get_ChartData()->get_Series()->get_Count();
s = chart->get_ChartData()->get_Categories()->get_Count();

// Thêm chuỗi
chart->get_ChartData()->get_Series()->Add(fact->GetCell(defaultWorksheetIndex, 0, 1, ObjectExt::Box<System::String>(u"Series 1")), chart->get_Type());
chart->get_ChartData()->get_Series()->Add(fact->GetCell(defaultWorksheetIndex, 0, 2, ObjectExt::Box<System::String>(u"Series 2")), chart->get_Type());

// Thêm danh mục
chart->get_ChartData()->get_Categories()->Add(fact->GetCell(defaultWorksheetIndex, 1, 0, ObjectExt::Box<System::String>(u"Category 1")));
chart->get_ChartData()->get_Categories()->Add(fact->GetCell(defaultWorksheetIndex, 2, 0, ObjectExt::Box<System::String>(u"Category 2")));
chart->get_ChartData()->get_Categories()->Add(fact->GetCell(defaultWorksheetIndex, 3, 0, ObjectExt::Box<System::String>(u"Category 3")));

// Lấy chuỗi biểu đồ đầu tiên
SharedPtr<IChartSeries> series = chart->get_ChartData()->get_Series()->idx_get(0);

// Điền dữ liệu chuỗi
series->get_DataPoints()->AddDataPointForBarSeries(fact->GetCell(defaultWorksheetIndex, 1, 1, ObjectExt::Box<double>(20)));
series->get_DataPoints()->AddDataPointForBarSeries(fact->GetCell(defaultWorksheetIndex, 2, 1, ObjectExt::Box<double>(50)));
series->get_DataPoints()->AddDataPointForBarSeries(fact->GetCell(defaultWorksheetIndex, 3, 1, ObjectExt::Box<double>(30)));

// Đặt màu tô cho chuỗi
series->get_Format()->get_Fill()->set_FillType(FillType::Solid);
series->get_Format()->get_Fill()->get_SolidFillColor()->set_Color(System::Drawing::Color::get_Blue());

// Lấy chuỗi biểu đồ thứ hai
series = chart->get_ChartData()->get_Series()->idx_get(1);

// Điền dữ liệu chuỗi
series->get_DataPoints()->AddDataPointForBarSeries(fact->GetCell(defaultWorksheetIndex, 1, 2, ObjectExt::Box<double>(30)));
series->get_DataPoints()->AddDataPointForBarSeries(fact->GetCell(defaultWorksheetIndex, 2, 2, ObjectExt::Box<double>(10)));
series->get_DataPoints()->AddDataPointForBarSeries(fact->GetCell(defaultWorksheetIndex, 3, 2, ObjectExt::Box<double>(60)));

// Đặt màu tô cho chuỗi
series->get_Format()->get_Fill()->set_FillType(FillType::Solid);
series->get_Format()->get_Fill()->get_SolidFillColor()->set_Color(System::Drawing::Color::get_Orange());

// Nhãn đầu tiên sẽ được hiển thị Tên danh mục
SharedPtr<IDataLabel> lbl = series->get_DataPoints()->idx_get(0)->get_Label();
lbl->get_DataLabelFormat()->set_ShowCategoryName(true);

lbl = series->get_DataPoints()->idx_get(1)->get_Label();
lbl->get_DataLabelFormat()->set_ShowSeriesName(true);

// Hiển thị giá trị cho nhãn thứ ba
lbl = series->get_DataPoints()->idx_get(2)->get_Label();
lbl->get_DataLabelFormat()->set_ShowValue(true);
lbl->get_DataLabelFormat()->set_ShowSeriesName(true);
lbl->get_DataLabelFormat()->set_Separator(u"/");

// Lưu tệp PPTX
pres->Save(outputFilePath, Aspose::Slides::Export::SaveFormat::Pptx);
Sau đây là hình ảnh của biểu đồ cột được tạo bởi mã mẫu.
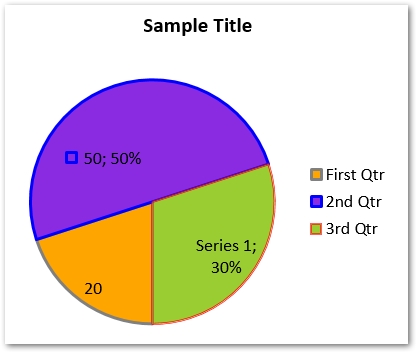
Tạo biểu đồ hình tròn trong bản trình bày PowerPoint bằng C ++
Sau đây là các bước để thêm biểu đồ hình tròn vào trang chiếu PowerPoint.
- Đầu tiên, tạo một thể hiện của lớp Trình bày.
- Truy cập trang chiếu mà bạn muốn thêm biểu đồ hình tròn bằng cách sử dụng Presentation-> getSlides() -> idxget (int32t index).
- Thêm biểu đồ Hình tròn vào trang chiếu bằng phương thức ISlide-> getShapes() -> AddChart (Charts :: ChartType type, float x, float y, float width, float height).
- Đặt tiêu đề của biểu đồ bằng phương thức IChart-> getChartTitle() -> AddTextFrameForOverriding (System :: String text).
- Xóa chuỗi và danh mục mặc định khỏi dữ liệu biểu đồ bằng cách sử dụng IChart-> getChartData() -> getSeries() -> Clear() và IChart-> getChartData() -> getCategories() -> Clear() phương pháp tương ứng.
- Truy cập sổ làm việc dữ liệu biểu đồ bằng phương pháp IChart-> getChartData() -> getChartDataWorkbook().
- Thêm chuỗi và danh mục mới bằng cách sử dụng IChart-> getChartData() -> getSeries() -> Thêm (System :: SharedPtr cellWithSeriesName, ChartType type) và IChart-> getChartData() -> getCategories() -> Thêm (System :: SharedPtr chartDataCell) phương thức tương ứng.
- Truy cập từng chuỗi bằng phương thức IChart-> getChartData() -> getSeries() -> idxget (int32t index).
- Thêm điểm dữ liệu bằng cách sử dụng IChartSeries-> getDataPoints() -> AddDataPointForPieSeries (System :: SharedPtr giá trị) phương pháp.
- Định dạng các điểm dữ liệu, thêm đường dẫn và đặt góc xoay.
- Cuối cùng, lưu bản trình bày có chứa biểu đồ hình tròn bằng phương pháp Presentation-> Save (System :: String name, Export :: SaveFormat format).
Sau đây là mã mẫu để thêm biểu đồ hình tròn trong các trang chiếu PowerPoint bằng C ++.
// Đường dẫn tệp đầu ra.
const String outputFilePath = u"OutputDirectory\\pie_chart.pptx";

// Khởi tạo lớp Trình bày đại diện cho tệp PPTX
SharedPtr<Presentation> pres = MakeObject<Presentation>();

// Truy cập trang trình bày đầu tiên
SharedPtr<ISlide> slide = pres->get_Slides()->idx_get(0);

// Thêm biểu đồ với dữ liệu mặc định
SharedPtr<IChart> chart = slide->get_Shapes()->AddChart(Aspose::Slides::Charts::ChartType::Pie, 0, 0, 500, 500);

// Đặt tiêu đề biểu đồ
chart->get_ChartTitle()->AddTextFrameForOverriding(u"Sample Title");
chart->get_ChartTitle()->get_TextFrameForOverriding()->get_TextFrameFormat()->set_CenterText(NullableBool::True);
chart->get_ChartTitle()->set_Height(20);
chart->set_HasTitle(true);

// Xóa chuỗi và danh mục được tạo mặc định
chart->get_ChartData()->get_Series()->Clear();
chart->get_ChartData()->get_Categories()->Clear();

// Đặt chỉ mục của bảng dữ liệu biểu đồ
int defaultWorksheetIndex = 0;

// Lấy sổ làm việc dữ liệu biểu đồ
SharedPtr<IChartDataWorkbook> fact = chart->get_ChartData()->get_ChartDataWorkbook();

// Thêm danh mục
chart->get_ChartData()->get_Categories()->Add(fact->GetCell(defaultWorksheetIndex, 1, 0, ObjectExt::Box<System::String>(u"First Qtr")));
chart->get_ChartData()->get_Categories()->Add(fact->GetCell(defaultWorksheetIndex, 2, 0, ObjectExt::Box<System::String>(u"2nd Qtr")));
chart->get_ChartData()->get_Categories()->Add(fact->GetCell(defaultWorksheetIndex, 3, 0, ObjectExt::Box<System::String>(u"3rd Qtr")));

// Thêm chuỗi
chart->get_ChartData()->get_Series()->Add(fact->GetCell(defaultWorksheetIndex, 0, 1, ObjectExt::Box<System::String>(u"Series 1")), chart->get_Type());

// Lấy chuỗi biểu đồ đầu tiên
SharedPtr<IChartSeries> series = chart->get_ChartData()->get_Series()->idx_get(0);

// Điền dữ liệu chuỗi
series->get_DataPoints()->AddDataPointForPieSeries(fact->GetCell(defaultWorksheetIndex, 1, 1, ObjectExt::Box<double>(20)));
series->get_DataPoints()->AddDataPointForPieSeries(fact->GetCell(defaultWorksheetIndex, 2, 1, ObjectExt::Box<double>(50)));
series->get_DataPoints()->AddDataPointForPieSeries(fact->GetCell(defaultWorksheetIndex, 3, 1, ObjectExt::Box<double>(30)));

chart->get_ChartData()->get_SeriesGroups()->idx_get(0)->set_IsColorVaried(true);

SharedPtr<IChartDataPoint> point = series->get_DataPoints()->idx_get(0);
point->get_Format()->get_Fill()->set_FillType(FillType::Solid);
point->get_Format()->get_Fill()->get_SolidFillColor()->set_Color(System::Drawing::Color::get_Orange());

// Đặt đường viền khu vực
point->get_Format()->get_Line()->get_FillFormat()->set_FillType(FillType::Solid);
point->get_Format()->get_Line()->get_FillFormat()->get_SolidFillColor()->set_Color(System::Drawing::Color::get_Gray());
point->get_Format()->get_Line()->set_Width(3.0);

SharedPtr<IChartDataPoint> point1 = series->get_DataPoints()->idx_get(1);
point1->get_Format()->get_Fill()->set_FillType(FillType::Solid);
point1->get_Format()->get_Fill()->get_SolidFillColor()->set_Color(System::Drawing::Color::get_BlueViolet());

// Đặt đường viền khu vực
point1->get_Format()->get_Line()->get_FillFormat()->set_FillType(FillType::Solid);
point1->get_Format()->get_Line()->get_FillFormat()->get_SolidFillColor()->set_Color(System::Drawing::Color::get_Blue());
point1->get_Format()->get_Line()->set_Width(3.0);

SharedPtr<IChartDataPoint> point2 = series->get_DataPoints()->idx_get(2);
point2->get_Format()->get_Fill()->set_FillType(FillType::Solid);
point2->get_Format()->get_Fill()->get_SolidFillColor()->set_Color(System::Drawing::Color::get_YellowGreen());

// Đặt đường viền khu vực
point2->get_Format()->get_Line()->get_FillFormat()->set_FillType(FillType::Solid);
point2->get_Format()->get_Line()->get_FillFormat()->get_SolidFillColor()->set_Color(System::Drawing::Color::get_Red());
point2->get_Format()->get_Line()->set_Width(2.0);

// Tạo nhãn tùy chỉnh cho từng danh mục trong chuỗi
SharedPtr<IDataLabel> lbl1 = series->get_DataPoints()->idx_get(0)->get_Label();

// lbl.ShowCategoryName = true;
lbl1->get_DataLabelFormat()->set_ShowValue(true);

SharedPtr<IDataLabel> lbl2 = series->get_DataPoints()->idx_get(1)->get_Label();
lbl2->get_DataLabelFormat()->set_ShowValue(true);
lbl2->get_DataLabelFormat()->set_ShowLegendKey(true);
lbl2->get_DataLabelFormat()->set_ShowPercentage(true);

SharedPtr<IDataLabel> lbl3 = series->get_DataPoints()->idx_get(2)->get_Label();

lbl3->get_DataLabelFormat()->set_ShowSeriesName(true);
lbl3->get_DataLabelFormat()->set_ShowPercentage(true);

// Hiển thị đường dẫn cho biểu đồ
series->get_Labels()->get_DefaultDataLabelFormat()->set_ShowLeaderLines(true);

// Đặt góc xoay cho các ngành biểu đồ hình tròn
chart->get_ChartData()->get_SeriesGroups()->idx_get(0)->set_FirstSliceAngle(180);

// Lưu tệp PPTX
pres->Save(outputFilePath, Aspose::Slides::Export::SaveFormat::Pptx);
Sau đây là hình ảnh của biểu đồ hình tròn được tạo bởi mã mẫu.
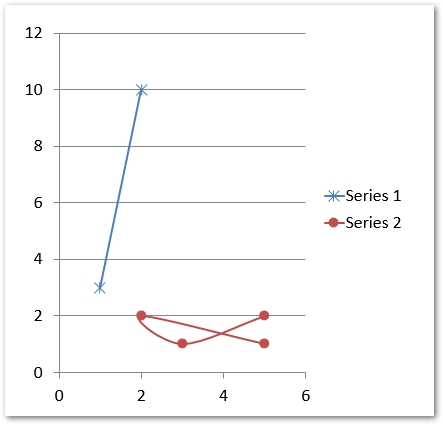
Tạo biểu đồ phân tán trong bản trình bày PowerPoint bằng C ++
Sau đây là các bước để thêm biểu đồ phân tán vào trang chiếu PowerPoint.
- Đầu tiên, tạo một thể hiện của lớp Presentation.
- Truy cập vào trang chiếu mà bạn muốn thêm biểu đồ phân tán bằng cách sử dụng Presentation-> getSlides() -> idxget (int32t index).
- Thêm biểu đồ ScatterWithSmoothLines vào trang chiếu bằng phương pháp ISlide-> getShapes() -> AddChart (Charts :: ChartType type, float x, float y, float width, float height).
- Xóa chuỗi mặc định khỏi dữ liệu biểu đồ bằng phương pháp IChart-> getChartData() -> getSeries() -> Clear().
- Truy cập sổ làm việc dữ liệu biểu đồ bằng phương pháp IChart-> getChartData() -> getChartDataWorkbook().
- Thêm chuỗi mới bằng IChart-> getChartData() -> getSeries() -> Thêm (System :: SharedPtr cellWithSeriesName, kiểu ChartType).
- Truy cập từng chuỗi bằng phương thức IChart-> getChartData() -> getSeries() -> idxget (int32t index).
- Thêm điểm dữ liệu bằng cách sử dụng IChartSeries-> getDataPoints() -> AddDataPointForScatterSeries (System :: SharedPtr xValue, Hệ thống :: SharedPtr yValue) phương thức.
- Đặt điểm đánh dấu cho chuỗi.
- Cuối cùng, lưu bản trình bày có chứa biểu đồ phân tán bằng phương pháp Presentation-> Save (System :: String name, Export :: SaveFormat format).
Sau đây là mã mẫu để thêm biểu đồ phân tán vào các trang chiếu PowerPoint bằng C ++.
// Đường dẫn tệp đầu ra.
const String outputFilePath = u"OutputDirectory\\scattered_chart.pptx";

// Khởi tạo lớp Trình bày đại diện cho tệp PPTX
SharedPtr<Presentation> pres = MakeObject<Presentation>();

// Truy cập trang trình bày đầu tiên
SharedPtr<ISlide> slide = pres->get_Slides()->idx_get(0);

// Thêm biểu đồ với dữ liệu mặc định
SharedPtr<IChart> chart = slide->get_Shapes()->AddChart(Aspose::Slides::Charts::ChartType::ScatterWithSmoothLines, 0, 0, 500, 500);

// Xóa chuỗi được tạo mặc định
chart->get_ChartData()->get_Series()->Clear();

// Đặt chỉ mục của bảng dữ liệu biểu đồ
int defaultWorksheetIndex = 0;

// Lấy sổ làm việc dữ liệu biểu đồ
SharedPtr<IChartDataWorkbook> fact = chart->get_ChartData()->get_ChartDataWorkbook();

// Thêm chuỗi
chart->get_ChartData()->get_Series()->Add(fact->GetCell(defaultWorksheetIndex, 1, 1, ObjectExt::Box<System::String>(u"Series 1")), chart->get_Type());
chart->get_ChartData()->get_Series()->Add(fact->GetCell(defaultWorksheetIndex, 1, 3, ObjectExt::Box<System::String>(u"Series 2")), chart->get_Type());

// Lấy chuỗi biểu đồ đầu tiên
SharedPtr<IChartSeries> series = chart->get_ChartData()->get_Series()->idx_get(0);

// Thêm điểm mới (1: 3) ở đó.
series->get_DataPoints()->AddDataPointForScatterSeries(fact->GetCell(defaultWorksheetIndex, 2, 1, ObjectExt::Box<double>(1)), fact->GetCell(defaultWorksheetIndex, 2, 2, ObjectExt::Box<double>(3)));

// Thêm điểm mới (2:10)
series->get_DataPoints()->AddDataPointForScatterSeries(fact->GetCell(defaultWorksheetIndex, 3, 1, ObjectExt::Box<double>(2)), fact->GetCell(defaultWorksheetIndex, 3, 2, ObjectExt::Box<double>(10)));

// Chỉnh sửa loại chuỗi
series->set_Type(ChartType::ScatterWithStraightLinesAndMarkers);

// Thay đổi điểm đánh dấu chuỗi biểu đồ
series->get_Marker()->set_Size(10);
series->get_Marker()->set_Symbol(MarkerStyleType::Star);

// Lấy chuỗi biểu đồ thứ hai
series = chart->get_ChartData()->get_Series()->idx_get(1);

// Thêm điểm mới (5: 2) ở đó.
series->get_DataPoints()->AddDataPointForScatterSeries(fact->GetCell(defaultWorksheetIndex, 2, 3, ObjectExt::Box<double>(5)), fact->GetCell(defaultWorksheetIndex, 2, 4, ObjectExt::Box<double>(2)));

// Thêm điểm mới (3: 1)
series->get_DataPoints()->AddDataPointForScatterSeries(fact->GetCell(defaultWorksheetIndex, 3, 3, ObjectExt::Box<double>(3)), fact->GetCell(defaultWorksheetIndex, 3, 4, ObjectExt::Box<double>(1)));

// Thêm điểm mới (2: 2)
series->get_DataPoints()->AddDataPointForScatterSeries(fact->GetCell(defaultWorksheetIndex, 4, 3, ObjectExt::Box<double>(2)), fact->GetCell(defaultWorksheetIndex, 4, 4, ObjectExt::Box<double>(2)));

// Thêm điểm mới (5: 1)
series->get_DataPoints()->AddDataPointForScatterSeries(fact->GetCell(defaultWorksheetIndex, 5, 3, ObjectExt::Box<double>(5)), fact->GetCell(defaultWorksheetIndex, 5, 4, ObjectExt::Box<double>(1)));

// Thay đổi điểm đánh dấu chuỗi biểu đồ
series->get_Marker()->set_Size(10);
series->get_Marker()->set_Symbol(MarkerStyleType::Circle);

// Lưu tệp PPTX
pres->Save(outputFilePath, Aspose::Slides::Export::SaveFormat::Pptx);
Sau đây là hình ảnh của biểu đồ phân tán được tạo bởi mã mẫu.
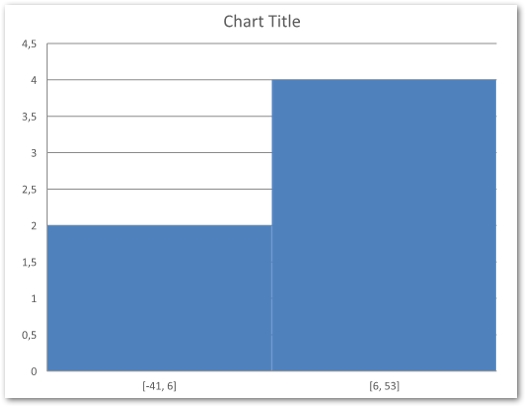
Tạo Biểu đồ Histogram trong Bản trình bày PowerPoint
Sau đây là các bước để tạo biểu đồ biểu đồ trong bản trình bày PowerPoint.
- Đầu tiên, tạo một thể hiện của lớp Trình bày.
- Truy cập vào trang chiếu mà bạn muốn thêm biểu đồ biểu đồ bằng cách sử dụng Presentation-> getSlides() -> idxget (int32t index).
- Thêm biểu đồ Histogram vào trang chiếu bằng phương pháp ISlide-> getShapes() -> AddChart (Charts :: ChartType type, float x, float y, float width, float height).
- Xóa chuỗi và danh mục mặc định khỏi dữ liệu biểu đồ bằng cách sử dụng IChart-> getChartData() -> getSeries() -> Clear() và IChart-> getChartData() -> getCategories() -> Clear() phương pháp tương ứng.
- Truy cập sổ làm việc dữ liệu biểu đồ bằng phương pháp IChart-> getChartData() -> getChartDataWorkbook().
- Thêm chuỗi mới bằng phương thức IChart-> getChartData() -> getSeries() -> Add (ChartType type).
- Thêm điểm dữ liệu bằng cách sử dụng IChartSeries-> getDataPoints() -> AddDataPointForHistogramSeries (System :: SharedPtr giá trị) phương pháp.
- Đặt kiểu tổng hợp của trục biểu đồ bằng phương pháp IChart-> getAxes() -> getHorizontalAxis() -> setAggregationType (AxisAggregationType value).
- Cuối cùng, lưu bản trình bày có chứa biểu đồ histogram bằng phương pháp Presentation-> Save (System :: String name, Export :: SaveFormat format).
Sau đây là mã mẫu để tạo biểu đồ biểu đồ trong bản trình bày PowerPoint bằng C ++.
// Đường dẫn tệp đầu ra.
const String outputFilePath = u"OutputDirectory\\histogram_chart.pptx";

// Khởi tạo lớp Trình bày đại diện cho tệp PPTX
SharedPtr<Presentation> pres = MakeObject<Presentation>();

// Truy cập trang trình bày đầu tiên
SharedPtr<ISlide> slide = pres->get_Slides()->idx_get(0);

// Thêm biểu đồ với dữ liệu mặc định
System::SharedPtr<IChart> chart = slide->get_Shapes()->AddChart(Aspose::Slides::Charts::ChartType::Histogram, 50, 50, 500, 400);

// Xóa chuỗi và danh mục được tạo mặc định
chart->get_ChartData()->get_Categories()->Clear();
chart->get_ChartData()->get_Series()->Clear();

// Lấy sổ làm việc dữ liệu biểu đồ
System::SharedPtr<IChartDataWorkbook> wb = chart->get_ChartData()->get_ChartDataWorkbook();

wb->Clear(0);

// Thêm chuỗi
System::SharedPtr<IChartSeries> series = chart->get_ChartData()->get_Series()->Add(Aspose::Slides::Charts::ChartType::Histogram);

// Điền dữ liệu chuỗi
series->get_DataPoints()->AddDataPointForHistogramSeries(wb->GetCell(0, u"A1", System::ObjectExt::Box<int32_t>(15)));
series->get_DataPoints()->AddDataPointForHistogramSeries(wb->GetCell(0, u"A2", System::ObjectExt::Box<int32_t>(-41)));
series->get_DataPoints()->AddDataPointForHistogramSeries(wb->GetCell(0, u"A3", System::ObjectExt::Box<int32_t>(16)));
series->get_DataPoints()->AddDataPointForHistogramSeries(wb->GetCell(0, u"A4", System::ObjectExt::Box<int32_t>(10)));
series->get_DataPoints()->AddDataPointForHistogramSeries(wb->GetCell(0, u"A5", System::ObjectExt::Box<int32_t>(-23)));
series->get_DataPoints()->AddDataPointForHistogramSeries(wb->GetCell(0, u"A6", System::ObjectExt::Box<int32_t>(16)));

// Đặt loại tổng hợp trục
chart->get_Axes()->get_HorizontalAxis()->set_AggregationType(Aspose::Slides::Charts::AxisAggregationType::Automatic);

// Lưu tệp PPTX
pres->Save(outputFilePath, Aspose::Slides::Export::SaveFormat::Pptx);
Sau đây là hình ảnh của biểu đồ histogram được tạo bởi mã mẫu.
Biểu đồ được hỗ trợ bổ sung
Ngoài các biểu đồ được hiển thị ở trên, Aspose.Slides for C ++ hỗ trợ nhiều loại biểu đồ hơn. Bạn có thể xem danh sách đầy đủ các loại biểu đồ được hỗ trợ với mã mẫu bằng cách đọc bài viết tài liệu này.
Nhận giấy phép miễn phí
Bạn có thể yêu cầu giấy phép tạm thời miễn phí để dùng thử API mà không có giới hạn đánh giá.
Sự kết luận
Trong bài này, bạn đã học cách thêm biểu đồ trong trang chiếu PowerPoint bằng C ++. Cụ thể, bạn đã học cách thêm biểu đồ Cột, Phân tán, Hình tròn và Biểu đồ trong bản trình bày PowerPoint của mình. Ngoài ra, bạn đã thấy rằng API Aspose.Slides cho C ++ cung cấp nhiều loại biểu đồ hơn để bạn sử dụng trong bản trình bày PowerPoint của mình. Bên cạnh biểu đồ, API còn chứng minh một loạt các tính năng để cải thiện bản trình bày PowerPoint của bạn. Bạn có thể khám phá API chi tiết bằng cách sử dụng tài liệu chính thức. Trong trường hợp có bất kỳ câu hỏi nào, vui lòng liên hệ với chúng tôi trên diễn đàn hỗ trợ miễn phí.