
Biểu đồ được sử dụng để tóm tắt và thể hiện trực quan dữ liệu trong bản trình bày. Để trực quan hóa dữ liệu, MS PowerPoint cung cấp nhiều loại biểu đồ. Trong số tất cả, các loại biểu đồ được sử dụng phổ biến nhất bao gồm biểu đồ tròn, biểu đồ đường, biểu đồ thanh, biểu đồ, biểu đồ chứng khoán, v.v. Trong bài viết này, bạn sẽ học cách tạo biểu đồ trong bản trình bày PowerPoint bằng Java.
- API để tạo biểu đồ trong PowerPoint
- Tạo biểu đồ cột trong PowerPoint bằng Java
- Tạo biểu đồ phân tán trong PowerPoint bằng Java
- Thêm biểu đồ hình tròn trong PowerPoint bằng Java
- Thêm biểu đồ Histogram trong PowerPoint bằng Java
- Tạo biểu đồ cổ phiếu trong PowerPoint bằng Java
Java API để tạo biểu đồ trong PowerPoint
Để tạo các loại biểu đồ khác nhau trong bản trình bày, chúng tôi sẽ sử dụng Aspose.Slides for Java. API nói trên cho phép bạn tạo và thao tác các bản trình bày PowerPoint từ bên trong các ứng dụng Java của bạn. Hơn nữa, nó cho phép bạn tạo và thêm biểu đồ vào các bài thuyết trình một cách liền mạch. Bạn có thể tải xuống API hoặc cài đặt nó bằng cách sử dụng các cấu hình Maven sau.
<repository>
    <id>AsposeJavaAPI</id>
    <name>Aspose Java API</name>
    <url>http://repository.aspose.com/repo/</url>
</repository>
<dependency>
    <groupId>com.aspose</groupId>
    <artifactId>aspose-slides</artifactId>
    <version>21.7</version>
    <classifier>jdk16</classifier>
</dependency>
Tạo biểu đồ cột trong PowerPoint PPT bằng Java
Sau đây là các bước để tạo biểu đồ cột trong bản trình bày PowerPoint bằng Java.
- Đầu tiên, tạo một thể hiện của lớp Presentation(chỉ định đường dẫn của tệp trong hàm tạo trong trường hợp tải bản trình bày exisitng).
- Lấy tham chiếu của trang chiếu bằng cách chỉ định chỉ mục của nó.
- Thêm biểu đồ với dữ liệu mặc định cùng với loại ChartType .ClusteredColumn.
- Xóa chuỗi và danh mục mặc định.
- Truy cập sổ làm việc dữ liệu biểu đồ trong đối tượng IChartDataWorkbook.
- Thêm chuỗi và danh mục mới của biểu đồ vào sổ làm việc.
- Thêm dữ liệu biểu đồ mới vào chuỗi biểu đồ.
- Cuối cùng, lưu bản trình bày bằng phương thức Presentation.save (String, SaveFormat).
Để trình diễn, mẫu mã sau đây cho biết cách tạo biểu đồ cột trong bản trình bày PowerPoint bằng Java.
// Tạo một bản trình bày mới
Presentation pres = new Presentation();
try {

    // Thêm biểu đồ cột mới và xóa các danh mục và chuỗi mặc định
    IChart ch = pres.getSlides().get_Item(0).getShapes().addChart(ChartType.ClusteredColumn, 100, 100, 600, 450);
    ch.getChartData().getSeries().clear();
    ch.getChartData().getCategories().clear();

    // Truy cập dữ liệu biểu đồ
    IChartDataWorkbook fact = ch.getChartData().getChartDataWorkbook();
    fact.clear(0);
    int defaultWorksheetIndex = 0;

    // Thêm danh mục
    IChartCategory category = ch.getChartData().getCategories().add(fact.getCell(0, "c2", "A"));
    category.getGroupingLevels().setGroupingItem(1, "Group1");
    category = ch.getChartData().getCategories().add(fact.getCell(0, "c3", "B"));

    category = ch.getChartData().getCategories().add(fact.getCell(0, "c4", "C"));
    category.getGroupingLevels().setGroupingItem(1, "Group2");
    category = ch.getChartData().getCategories().add(fact.getCell(0, "c5", "D"));

    category = ch.getChartData().getCategories().add(fact.getCell(0, "c6", "E"));
    category.getGroupingLevels().setGroupingItem(1, "Group3");
    category = ch.getChartData().getCategories().add(fact.getCell(0, "c7", "F"));

    category = ch.getChartData().getCategories().add(fact.getCell(0, "c8", "G"));
    category.getGroupingLevels().setGroupingItem(1, "Group4");
    category = ch.getChartData().getCategories().add(fact.getCell(0, "c9", "H"));

    // Thêm chuỗi
    IChartSeries series = ch.getChartData().getSeries().add(fact.getCell(0, "D1", "Series 1"),
            ChartType.ClusteredColumn);

    series.getDataPoints().addDataPointForBarSeries(fact.getCell(defaultWorksheetIndex, "D2", 10));
    series.getDataPoints().addDataPointForBarSeries(fact.getCell(defaultWorksheetIndex, "D3", 20));
    series.getDataPoints().addDataPointForBarSeries(fact.getCell(defaultWorksheetIndex, "D4", 30));
    series.getDataPoints().addDataPointForBarSeries(fact.getCell(defaultWorksheetIndex, "D5", 40));
    series.getDataPoints().addDataPointForBarSeries(fact.getCell(defaultWorksheetIndex, "D6", 50));
    series.getDataPoints().addDataPointForBarSeries(fact.getCell(defaultWorksheetIndex, "D7", 60));
    series.getDataPoints().addDataPointForBarSeries(fact.getCell(defaultWorksheetIndex, "D8", 70));
    series.getDataPoints().addDataPointForBarSeries(fact.getCell(defaultWorksheetIndex, "D9", 80));

    // Lưu bản trình bày với biểu đồ
    pres.save("column-chart.pptx", SaveFormat.Pptx);
} finally {
    if (pres != null) pres.dispose();
}
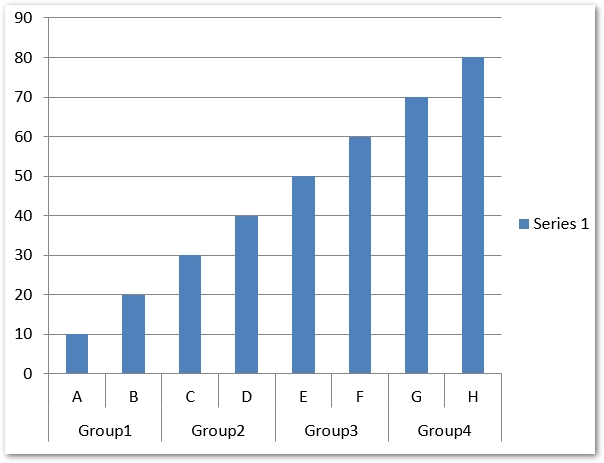
Sau đây là ảnh chụp màn hình của biểu đồ cột kết quả.
Tạo biểu đồ phân tán trong PowerPoint PPT bằng Java
Sau đây là các bước để tạo biểu đồ phân tán trong bản trình bày PowerPoint bằng Java.
- Tạo bản trình bày mới hoặc tải bản trình bày hiện có bằng cách sử dụng lớp Trình bày.
- Nhận tham chiếu của trang chiếu trong đối tượng ISlide.
- Thêm loại biểu đồ ScatterWithSmoothLines với dữ liệu mặc định và lấy tham chiếu của nó trong đối tượng IChart.
- Truy cập sổ làm việc dữ liệu biểu đồ vào đối tượng IChartDataWorkbook và xóa chuỗi mặc định.
- Thêm chuỗi mới vào dữ liệu biểu đồ.
- Truy cập từng chuỗi vào đối tượng IChartSeries và thêm điểm dữ liệu vào chuỗi.
- Truy cập điểm đánh dấu của chuỗi bằng IChartSeries.getMarker() và đặt thuộc tính của nó.
- Lưu bản trình bày bằng phương thức Presentation.save (String, SaveFormat).
Mẫu mã sau đây cho thấy cách tạo biểu đồ phân tán trong bản trình bày PowerPoint bằng Java.
// Khởi tạo lớp Trình bày đại diện cho tệp PPTX
Presentation pres = new Presentation();
try {
    // Truy cập trang trình bày đầu tiên
    ISlide slide = pres.getSlides().get_Item(0);

    // Tạo biểu đồ mặc định
    IChart chart = slide.getShapes().addChart(ChartType.ScatterWithSmoothLines, 0, 0, 400, 400);

    // Nhận chỉ mục trang tính dữ liệu biểu đồ mặc định
    int defaultWorksheetIndex = 0;

    // Nhận bảng dữ liệu biểu đồ
    IChartDataWorkbook fact = chart.getChartData().getChartDataWorkbook();

    // Xóa chuỗi bản trình diễn
    chart.getChartData().getSeries().clear();

    // Thêm sê-ri mới
    chart.getChartData().getSeries().add(fact.getCell(defaultWorksheetIndex, 1, 1, "Series 1"), chart.getType());
    chart.getChartData().getSeries().add(fact.getCell(defaultWorksheetIndex, 1, 3, "Series 2"), chart.getType());

    // Lấy chuỗi biểu đồ đầu tiên
    IChartSeries series = chart.getChartData().getSeries().get_Item(0);

    // Thêm điểm mới (1: 3) ở đó.
    series.getDataPoints().addDataPointForScatterSeries(fact.getCell(defaultWorksheetIndex, 2, 1, 1), fact.getCell(defaultWorksheetIndex, 2, 2, 3));

    // Thêm điểm mới (2:10)
    series.getDataPoints().addDataPointForScatterSeries(fact.getCell(defaultWorksheetIndex, 3, 1, 2), fact.getCell(defaultWorksheetIndex, 3, 2, 10));

    // Chỉnh sửa loại chuỗi
    series.setType(ChartType.ScatterWithStraightLinesAndMarkers);

    // Thay đổi điểm đánh dấu chuỗi biểu đồ
    series.getMarker().setSize(10);
    series.getMarker().setSymbol(MarkerStyleType.Star);

    // Lấy chuỗi biểu đồ thứ hai
    series = chart.getChartData().getSeries().get_Item(1);

    // Thêm điểm mới (5: 2) ở đó.
    series.getDataPoints().addDataPointForScatterSeries(fact.getCell(defaultWorksheetIndex, 2, 3, 5), fact.getCell(defaultWorksheetIndex, 2, 4, 2));

    // Thêm điểm mới (3: 1)
    series.getDataPoints().addDataPointForScatterSeries(fact.getCell(defaultWorksheetIndex, 3, 3, 3), fact.getCell(defaultWorksheetIndex, 3, 4, 1));

    // Thêm điểm mới (2: 2)
    series.getDataPoints().addDataPointForScatterSeries(fact.getCell(defaultWorksheetIndex, 4, 3, 2), fact.getCell(defaultWorksheetIndex, 4, 4, 2));

    // Thêm điểm mới (5: 1)
    series.getDataPoints().addDataPointForScatterSeries(fact.getCell(defaultWorksheetIndex, 5, 3, 5), fact.getCell(defaultWorksheetIndex, 5, 4, 1));

    // Thay đổi điểm đánh dấu chuỗi biểu đồ
    series.getMarker().setSize(10);
    series.getMarker().setSymbol(MarkerStyleType.Circle);

    // Lưu bản trình bày
    pres.save("scatter-chart.pptx", SaveFormat.Pptx);
} finally {
    if (pres != null) pres.dispose();
}
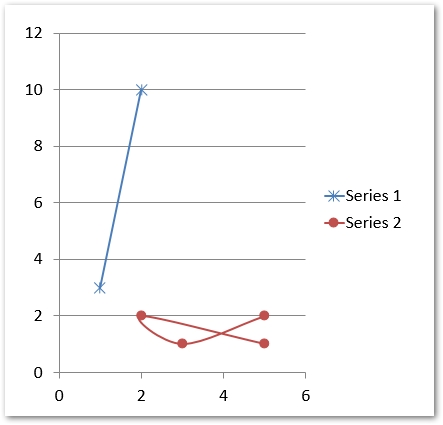
Ảnh chụp màn hình sau đây cho thấy biểu đồ phân tán kết quả.
Tạo biểu đồ hình tròn trong PowerPoint PPT bằng Java
Sau đây là các bước để tạo biểu đồ hình tròn trong bản trình bày PowerPoint bằng Java.
- Tạo bản trình bày mới hoặc tải bản trình bày hiện có bằng cách sử dụng lớp Trình bày.
- Tham khảo trang trình bày bằng cách cung cấp chỉ mục của nó.
- Thêm biểu đồ với dữ liệu mặc định cùng với loại ChartType .Pie.
- Truy cập dữ liệu biểu đồ trong đối tượng IChartDataWorkbook.
- Xóa chuỗi và danh mục mặc định.
- Tạo chuỗi và danh mục mới.
- Thêm dữ liệu biểu đồ mới cho chuỗi biểu đồ.
- Thêm điểm mới cho biểu đồ và thêm màu tùy chỉnh cho các ngành của biểu đồ hình tròn.
- Đặt nhãn cho chuỗi và dòng dẫn cho nhãn.
- Đặt góc xoay cho các trang trình bày biểu đồ hình tròn.
- Lưu bản trình bày bằng phương thức Presentation.save (String, SaveFormat).
Mẫu mã sau đây cho thấy cách tạo biểu đồ hình tròn trong bản trình bày PowerPoint bằng Java.
// Khởi tạo lớp Trình bày đại diện cho tệp PPTX
Presentation pres = new Presentation();
try {
    // Truy cập trang trình bày đầu tiên
    ISlide slides = pres.getSlides().get_Item(0);

    // Thêm biểu đồ với dữ liệu mặc định
    IChart chart = slides.getShapes().addChart(ChartType.Pie, 100, 100, 400, 400);

    // Đặt tiêu đề biểu đồ
    chart.getChartTitle().addTextFrameForOverriding("Sample Title");
    chart.getChartTitle().getTextFrameForOverriding().getTextFrameFormat().setCenterText(NullableBool.True);
    chart.getChartTitle().setHeight(20);
    chart.setTitle(true);

    // Đặt chuỗi đầu tiên thành Hiển thị giá trị
    chart.getChartData().getSeries().get_Item(0).getLabels().getDefaultDataLabelFormat().setShowValue(true);

    // Đặt chỉ mục của bảng dữ liệu biểu đồ
    int defaultWorksheetIndex = 0;

    // Nhận bảng dữ liệu biểu đồ
    IChartDataWorkbook fact = chart.getChartData().getChartDataWorkbook();

    // Xóa chuỗi và danh mục được tạo mặc định
    chart.getChartData().getSeries().clear();
    chart.getChartData().getCategories().clear();

    // Thêm danh mục mới
    chart.getChartData().getCategories().add(fact.getCell(0, 1, 0, "First Qtr"));
    chart.getChartData().getCategories().add(fact.getCell(0, 2, 0, "2nd Qtr"));
    chart.getChartData().getCategories().add(fact.getCell(0, 3, 0, "3rd Qtr"));

    // Thêm sê-ri mới
    IChartSeries series = chart.getChartData().getSeries().add(fact.getCell(0, 0, 1, "Series 1"), chart.getType());

    // Hiện đang điền dữ liệu chuỗi
    series.getDataPoints().addDataPointForPieSeries(fact.getCell(defaultWorksheetIndex, 1, 1, 20));
    series.getDataPoints().addDataPointForPieSeries(fact.getCell(defaultWorksheetIndex, 2, 1, 50));
    series.getDataPoints().addDataPointForPieSeries(fact.getCell(defaultWorksheetIndex, 3, 1, 30));

    // Không hoạt động trong phiên bản mới
    // Thêm điểm mới và thiết lập màu khu vực
    // loạt.IsColorVaried = true;
    chart.getChartData().getSeriesGroups().get_Item(0).setColorVaried(true);

    IChartDataPoint point = series.getDataPoints().get_Item(0);
    point.getFormat().getFill().setFillType(FillType.Solid);
    point.getFormat().getFill().getSolidFillColor().setColor(Color.CYAN);

    // Đặt đường viền khu vực
    point.getFormat().getLine().getFillFormat().setFillType(FillType.Solid);
    point.getFormat().getLine().getFillFormat().getSolidFillColor().setColor(Color.GRAY);
    point.getFormat().getLine().setWidth(3.0);
    //point.getFormat(). getLine(). setStyle (LineStyle.ThinThick);
    //point.getFormat(). getLine(). setDashStyle (LineDashStyle.DashDot);

    IChartDataPoint point1 = series.getDataPoints().get_Item(1);
    point1.getFormat().getFill().setFillType(FillType.Solid);
    point1.getFormat().getFill().getSolidFillColor().setColor(Color.ORANGE);

    // Đặt đường viền khu vực
    point1.getFormat().getLine().getFillFormat().setFillType(FillType.Solid);
    point1.getFormat().getLine().getFillFormat().getSolidFillColor().setColor(Color.BLUE);
    point1.getFormat().getLine().setWidth(3.0);
    //point1.getFormat(). getLine(). setStyle (LineStyle.Single);
    //point1.getFormat(). getLine(). setDashStyle (LineDashStyle.LargeDashDot);

    IChartDataPoint point2 = series.getDataPoints().get_Item(2);
    point2.getFormat().getFill().setFillType(FillType.Solid);
    point2.getFormat().getFill().getSolidFillColor().setColor(Color.YELLOW);

    // Đặt đường viền khu vực
    point2.getFormat().getLine().getFillFormat().setFillType(FillType.Solid);
    point2.getFormat().getLine().getFillFormat().getSolidFillColor().setColor(Color.RED);
    point2.getFormat().getLine().setWidth(2.0);
    //point2.getFormat(). getLine(). setStyle (LineStyle.ThinThin);
    //point2.getFormat(). getLine(). setDashStyle (LineDashStyle.LargeDashDotDot);

    // Tạo nhãn tùy chỉnh cho từng danh mục cho loạt phim mới
    IDataLabel lbl1 = series.getDataPoints().get_Item(0).getLabel();

    // lbl.ShowCategoryName = true;
    lbl1.getDataLabelFormat().setShowValue(true);

    IDataLabel lbl2 = series.getDataPoints().get_Item(1).getLabel();
    lbl2.getDataLabelFormat().setShowValue(true);
    lbl2.getDataLabelFormat().setShowLegendKey(true);
    lbl2.getDataLabelFormat().setShowPercentage(true);

    IDataLabel lbl3 = series.getDataPoints().get_Item(2).getLabel();
    lbl3.getDataLabelFormat().setShowSeriesName(true);
    lbl3.getDataLabelFormat().setShowPercentage(true);

    // Hiển thị đường dẫn cho biểu đồ
    series.getLabels().getDefaultDataLabelFormat().setShowLeaderLines(true);

    // Đặt góc xoay cho các ngành biểu đồ hình tròn
    chart.getChartData().getSeriesGroups().get_Item(0).setFirstSliceAngle(180);

    // Lưu bản trình bày với biểu đồ
    pres.save("pie-chart.pptx", SaveFormat.Pptx);
} finally {
    if (pres != null) pres.dispose();
}
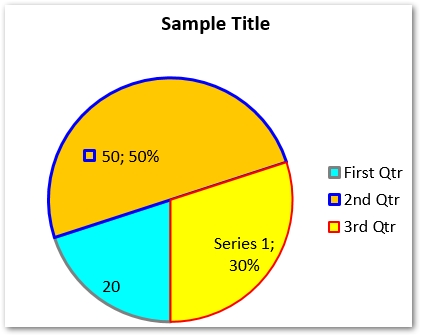
Sau đây là ảnh chụp màn hình của biểu đồ hình tròn được tạo.
Thêm Biểu đồ Histogram trong PowerPoint PPTX bằng Java
Sau đây là các bước để tạo biểu đồ biểu đồ trong bản trình bày PowerPoint sử dụng Java.
- Tạo bản trình bày mới hoặc tải bản trình bày hiện có bằng cách sử dụng lớp Trình bày.
- Lấy tham chiếu của slide bằng cách cung cấp chỉ mục của nó.
- Thêm biểu đồ với dữ liệu mặc định cùng với loại ChartType .Histogram.
- Truy cập dữ liệu biểu đồ trong đối tượng IChartDataWorkbook.
- Xóa chuỗi và danh mục mặc định.
- Thêm loạt và danh mục mới.
- Lưu bản trình bày bằng phương thức Presentation.save (String, SaveFormat).
Mẫu mã sau đây cho thấy cách tạo biểu đồ histogram bằng Java.
// Tạo một bản trình bày mới
Presentation pres = new Presentation();
try {

    // Thêm biểu đồ histogram mới và xóa các danh mục và chuỗi của nó
    IChart chart = pres.getSlides().get_Item(0).getShapes().addChart(ChartType.Histogram, 50, 50, 500, 400);
    chart.getChartData().getCategories().clear();
    chart.getChartData().getSeries().clear();

    // Truy cập dữ liệu biểu đồ
    IChartDataWorkbook wb = chart.getChartData().getChartDataWorkbook();
    wb.clear(0);

    // Thêm chuỗi
    IChartSeries series = chart.getChartData().getSeries().add(ChartType.Histogram);
    series.getDataPoints().addDataPointForHistogramSeries(wb.getCell(0, "A1", 15));
    series.getDataPoints().addDataPointForHistogramSeries(wb.getCell(0, "A2", -41));
    series.getDataPoints().addDataPointForHistogramSeries(wb.getCell(0, "A3", 16));
    series.getDataPoints().addDataPointForHistogramSeries(wb.getCell(0, "A4", 10));
    series.getDataPoints().addDataPointForHistogramSeries(wb.getCell(0, "A5", -23));
    series.getDataPoints().addDataPointForHistogramSeries(wb.getCell(0, "A6", 16));

    chart.getAxes().getHorizontalAxis().setAggregationType(AxisAggregationType.Automatic);

    // Lưu bản trình bày
    pres.save("histogram-chart.pptx", SaveFormat.Pptx);
} finally {
    if (pres != null) pres.dispose();
}
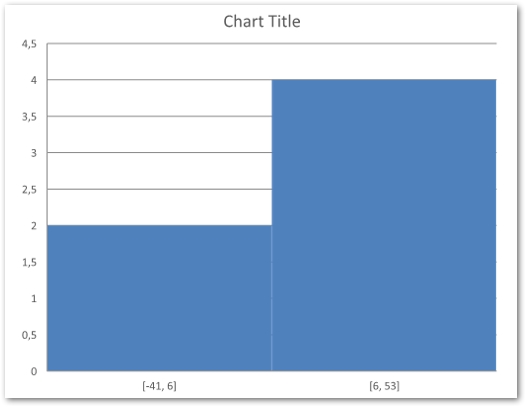
Sau đây là ảnh chụp màn hình của biểu đồ histogram đã tạo.
Tạo biểu đồ cổ phiếu trong PowerPoint bằng Java
Biểu đồ cổ phiếu cũng là một trong những loại biểu đồ thường được sử dụng trong các bài thuyết trình PowerPoint. Sau đây là các bước để tạo biểu đồ cổ phiếu trong Java.
- Tạo một thể hiện của lớp Trình bày.
- Lấy tham chiếu của slide bằng cách cung cấp chỉ mục của nó.
- Thêm biểu đồ với dữ liệu mặc định cùng với kiểu ChartType .OpenHighLowClose.
- Truy cập dữ liệu biểu đồ trong đối tượng IChartDataWorkbook.
- Xóa chuỗi và danh mục mặc định.
- Thêm loạt và danh mục mới.
- Thêm dữ liệu biểu đồ mới cho chuỗi biểu đồ.
- Chỉ định định dạng HiLowLines.
- Lưu bản trình bày bằng phương thức Presentation.save (String, SaveFormat).
Mẫu mã sau đây cho thấy cách thêm biểu đồ cổ phiếu vào bản trình bày PowerPoint bằng C#.
// Tạo một bản trình bày mới
Presentation pres = new Presentation();
try {

    // Thêm biểu đồ
    IChart chart = pres.getSlides().get_Item(0).getShapes().addChart(ChartType.OpenHighLowClose, 50, 50, 600, 400, false);

    // Xóa danh mục và chuỗi
    chart.getChartData().getSeries().clear();
    chart.getChartData().getCategories().clear();

    // Truy cập dữ liệu biểu đồ
    IChartDataWorkbook wb = chart.getChartData().getChartDataWorkbook();

    // Thêm danh mục
    chart.getChartData().getCategories().add(wb.getCell(0, 1, 0, "A"));
    chart.getChartData().getCategories().add(wb.getCell(0, 2, 0, "B"));
    chart.getChartData().getCategories().add(wb.getCell(0, 3, 0, "C"));

    chart.getChartData().getSeries().add(wb.getCell(0, 0, 1, "Open"), chart.getType());
    chart.getChartData().getSeries().add(wb.getCell(0, 0, 2, "High"), chart.getType());
    chart.getChartData().getSeries().add(wb.getCell(0, 0, 3, "Low"), chart.getType());
    chart.getChartData().getSeries().add(wb.getCell(0, 0, 4, "Close"), chart.getType());

    // Thêm dữ liệu chuỗi
    IChartSeries series = chart.getChartData().getSeries().get_Item(0);

    series.getDataPoints().addDataPointForStockSeries(wb.getCell(0, 1, 1, 72));
    series.getDataPoints().addDataPointForStockSeries(wb.getCell(0, 2, 1, 25));
    series.getDataPoints().addDataPointForStockSeries(wb.getCell(0, 3, 1, 38));

    series = chart.getChartData().getSeries().get_Item(1);
    series.getDataPoints().addDataPointForStockSeries(wb.getCell(0, 1, 2, 172));
    series.getDataPoints().addDataPointForStockSeries(wb.getCell(0, 2, 2, 57));
    series.getDataPoints().addDataPointForStockSeries(wb.getCell(0, 3, 2, 57));

    series = chart.getChartData().getSeries().get_Item(2);
    series.getDataPoints().addDataPointForStockSeries(wb.getCell(0, 1, 3, 12));
    series.getDataPoints().addDataPointForStockSeries(wb.getCell(0, 2, 3, 12));
    series.getDataPoints().addDataPointForStockSeries(wb.getCell(0, 3, 3, 13));

    series = chart.getChartData().getSeries().get_Item(3);
    series.getDataPoints().addDataPointForStockSeries(wb.getCell(0, 1, 4, 25));
    series.getDataPoints().addDataPointForStockSeries(wb.getCell(0, 2, 4, 38));
    series.getDataPoints().addDataPointForStockSeries(wb.getCell(0, 3, 4, 50));

    chart.getChartData().getSeriesGroups().get_Item(0).getUpDownBars().setUpDownBars(true);
    chart.getChartData().getSeriesGroups().get_Item(0).getHiLowLinesFormat().getLine().getFillFormat().setFillType(FillType.Solid);

   for (IChartSeries ser : chart.getChartData().getSeries())
    {
        ser.getFormat().getLine().getFillFormat().setFillType(FillType.NoFill);
    }

    // Lưu bản trình bày
    pres.save("output.pptx", SaveFormat.Pptx);
} finally {
    if (pres != null) pres.dispose();
}
Sau đây là ảnh chụp màn hình của biểu đồ cổ phiếu đã tạo.

Các loại biểu đồ khác
Ngoài các biểu đồ nêu trên, còn có các loại biểu đồ khác mà bạn có thể thêm vào bản trình bày PowerPoint. Để đọc thêm về các loại biểu đồ được hỗ trợ, bạn có thể truy cập bài viết tài liệu này.
Nhận giấy phép API miễn phí
Bạn có thể nhận giấy phép tạm thời miễn phí để sử dụng API mà không có giới hạn đánh giá.
Thử trực tuyến
Bạn cũng có thể thử công cụ trực tuyến miễn phí để tạo biểu đồ trong bản trình bày PowerPoint, dựa trên Aspose.Slides.
Sự kết luận
Trong bài này, bạn đã học cách tạo biểu đồ trong bản trình bày PowerPoint bằng Java. Hướng dẫn từng bước và các mẫu mã đã chỉ ra cách thêm biểu đồ cột, biểu đồ phân tán, biểu đồ hình tròn, biểu đồ và biểu đồ cổ phiếu. Bạn có thể khám phá thêm về Aspose.Slides for Java bằng tài liệu. Trong trường hợp bạn có bất kỳ thắc mắc nào, hãy thông báo cho chúng tôi qua diễn đàn của chúng tôi.