
Excel 圖表通常用於直觀地表示和描述電子表格中的數據。您可以在 Excel 中創建各種圖表,例如折線圖、條形圖、餅圖、圓環圖、金字塔圖、氣泡圖等。在本文中,您將學習如何使用 Python 在 Excel 文件中創建圖表。我們將創建一些圖表來演示使用 Python 以編程方式創建 Excel 圖表對您來說是多麼容易。
- 用於在 Excel 中創建圖表的 Python 庫 - 免費下載
- 在 Python 中創建 Excel 圖表的簡單步驟
- 支持的 Excel 圖表類型
- 使用 Python 在 Excel 中創建圖表
- 在 Excel 中創建 3D 柱形圖
- 在 Excel 中生成餅圖
- 在 Excel 中創建氣泡圖
- 獲得免費許可證
用於創建 Excel 圖表的 Python 庫 - 免費下載
為了在 Python 中使用 Excel 數據創建圖表,我們將使用 Aspose.Cells for Python。它是一個功能豐富的庫,可讓您在 Python 應用程序中實現 Excel 自動化。此外,它還允許您無縫地創建各種圖表。您可以使用以下命令從 PyPI 將其安裝到您的 Python 應用程序中。
pip install aspose-cells
在 Python 中創建 Excel 圖表的簡單步驟
Aspose.Cells for Python 簡化了在 Python 中以編程方式創建 Excel 圖表的過程。以下是使用 Aspose.Cells for Python 在 Excel 中創建每種圖表類型所需的基本步驟。
- 加載 Excel 文件或創建新工作簿。
- 將數據插入工作簿(如果為空)。
- 選擇工作表並添加所需類型的圖表。
- 向圖表添加數據范圍。
- 將 Excel 文件保存到所需位置。
支持的 Excel 圖表類型
Aspose.Cells for Python 提供了一套完整的標準圖表類型。該列表包括但不限於:
- 柱子
- 柱子Stacked
- 柱子100PercentStacked
- 柱子3DClustered
- 柱子3DStacked
- 柱子3D100PercentStacked
- 柱子3D
- 酒吧
- 酒吧Stacked
- 酒吧100PercentStacked
- 酒吧3DClustered
- 酒吧3DStacked
- 酒吧3D100PercentStacked
- 線
- 線Stacked
- 線100PercentStacked
- 線WithDataMarkers
- 線StackedWithDataMarkers
- 線100PercentStackedWithDataMarkers
- 線3D
- 餡餅
- 餡餅3D
- 餡餅Pie
- 餡餅Exploded
- 餡餅3DExploded
- 餡餅Bar
- 分散
- 分散ConnectedByCurvesWithDataMarker
使用 Python 在 Excel 中創建圖表
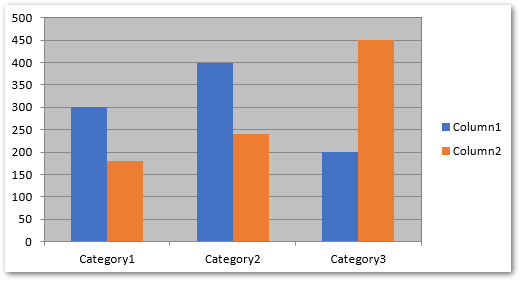
下面我們來看看如何將上述步驟轉化為Python,在Excel工作表中生成圖表。為了演示,讓我們創建一個柱形圖。
- 首先,創建一個新的 Excel 工作簿或使用 Workbook 類加載現有工作簿。
- 將所需工作表的引用獲取到對像中。
- 將數據插入工作表(如果工作表為空)。
- 使用 Worksheet.getCharts().add(type, upperLeftRow, upperLeftColumn, lowerRightRow, lowerRightColumn) 方法在工作表中創建圖表。
- 通過圖表在對像中的索引獲取圖表的引用。
- 使用 Chart.setChartDataRange(range, bool) 方法為圖表設置數據源。
- 最後,使用 Workbook.save(string) 方法保存工作簿。
以下代碼示例展示瞭如何在 Python 中創建 Excel 圖表。
import jpype
import asposecells

jpype.startJVM()
from asposecells.api import Workbook, ChartType, FileFormatType

# 創建工作簿對象
workbook = Workbook(FileFormatType.XLSX)

# 獲取第一個工作表的引用並添加數據
worksheet = workbook.getWorksheets().get(0)
worksheet.getCells().get("A2").putValue("Category1")
worksheet.getCells().get("A3").putValue("Category2")
worksheet.getCells().get("A4").putValue("Category3")
worksheet.getCells().get("B1").putValue("Column1")
worksheet.getCells().get("B2").putValue(300)
worksheet.getCells().get("B3").putValue(400)
worksheet.getCells().get("B4").putValue(200)
worksheet.getCells().get("C1").putValue("Column2")
worksheet.getCells().get("C2").putValue(180)
worksheet.getCells().get("C3").putValue(240)
worksheet.getCells().get("C4").putValue(450)

# 向工作表添加柱形圖
chartIndex = worksheet.getCharts().add(ChartType.COLUMN, 6, 2, 22, 10)

# 訪問新添加圖表的實例
chart = worksheet.getCharts().get(chartIndex)

# 設置圖表數據源為範圍“A1:B4”
chart.setChartDataRange("A1:C4", True)

# 保存 Excel 文件
workbook.save("excel-column-chart.xlsx")
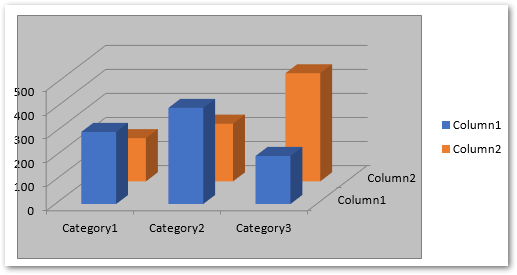
Python:在 Excel 中創建 3D 柱形圖
要在 Excel 中創建 3D 柱形圖,只需在 Worksheet.getCharts().add() 方法中指定 ChartType.COLUMN3D 類型即可。其餘步驟將與上一節中提到的相同。
以下代碼示例顯示瞭如何使用 Python 在 Excel 中添加 3D 柱形圖。
import jpype
import asposecells

jpype.startJVM()
from asposecells.api import Workbook, ChartType, FileFormatType

# 創建工作簿對象
workbook = Workbook(FileFormatType.XLSX)

# 獲取第一個工作表的引用並添加數據
worksheet = workbook.getWorksheets().get(0)
worksheet.getCells().get("A2").putValue("Category1")
worksheet.getCells().get("A3").putValue("Category2")
worksheet.getCells().get("A4").putValue("Category3")
worksheet.getCells().get("B1").putValue("Column1")
worksheet.getCells().get("B2").putValue(300)
worksheet.getCells().get("B3").putValue(400)
worksheet.getCells().get("B4").putValue(200)
worksheet.getCells().get("C1").putValue("Column2")
worksheet.getCells().get("C2").putValue(180)
worksheet.getCells().get("C3").putValue(240)
worksheet.getCells().get("C4").putValue(450)

# 向工作表添加柱狀 3D 圖表
chartIndex = worksheet.getCharts().add(ChartType.COLUMN_3_D, 6, 2, 22, 10)

# 訪問新添加圖表的實例
chart = worksheet.getCharts().get(chartIndex)

# 設置圖表數據源為範圍“A1:B4”
chart.setChartDataRange("A1:C4", True)

# 保存 Excel 文件
workbook.save("excel-column3d-chart.xlsx")
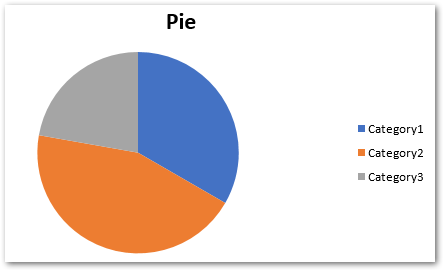
使用 Python 在 Excel 中創建餅圖
要創建餅圖,只需在將圖表添加到工作表時傳遞 ChartType.PIE 類型即可。您可以動態地將數據插入工作表或在加載 Excel 文件之前添加數據。
以下代碼示例顯示瞭如何使用 Python 在 Excel 中插入餅圖。
import jpype
import asposecells

jpype.startJVM()
from asposecells.api import Workbook, ChartType, FileFormatType

# 創建工作簿對象
workbook = Workbook(FileFormatType.XLSX)

# 獲取第一個工作表的引用並添加數據
worksheet = workbook.getWorksheets().get(0)
worksheet.getCells().get("A2").putValue("Category1")
worksheet.getCells().get("A3").putValue("Category2")
worksheet.getCells().get("A4").putValue("Category3")
worksheet.getCells().get("B1").putValue("Pie")
worksheet.getCells().get("B2").putValue(300)
worksheet.getCells().get("B3").putValue(400)
worksheet.getCells().get("B4").putValue(200)

# 向工作表添加餅圖
chartIndex = worksheet.getCharts().add(ChartType.PIE, 6, 2, 22, 10)

# 訪問新添加圖表的實例
chart = worksheet.getCharts().get(chartIndex)

# 設置圖表數據源為範圍“A1:B4”
chart.setChartDataRange("A1:B4", True)

# 保存 Excel 文件
workbook.save("excel-pie-chart.xlsx")
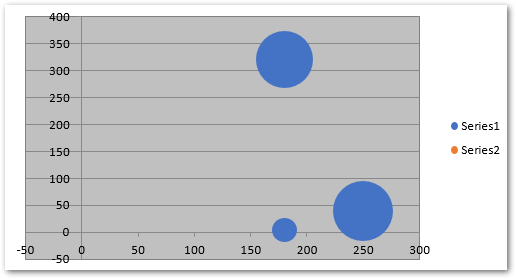
在 Excel 中創建氣泡圖
要在 Excel 中創建氣泡圖,您需要在 Worksheet.getCharts().add() 方法中傳遞 ChartType.BUBBLE。此外,您還必須將數據范圍添加到圖表系列。此外,您還可以設置氣泡大小以及 X 和 Y 坐標值。
以下代碼示例顯示瞭如何在 Python 中的 Excel 中創建氣泡圖。
import jpype
import asposecells

jpype.startJVM()
from asposecells.api import Workbook, ChartType, FileFormatType

# 創建工作簿對象
workbook = Workbook(FileFormatType.XLSX)

# 獲取第一個工作表的引用並添加數據
worksheet = workbook.getWorksheets().get(0)
# 向單元格添加一些示例值
cells = worksheet.getCells()
cell = cells.get("A1")
cell.setValue(50)
cell = cells.get("A2")
cell.setValue(100)
cell = cells.get("A3")
cell.setValue(150)
cell = cells.get("B1")
cell.setValue(4)
cell = cells.get("B2")
cell.setValue(20)
cell = cells.get("B3")
cell.setValue(180)
cell = cells.get("C1")
cell.setValue(320)
cell = cells.get("C2")
cell.setValue(110)
cell = cells.get("C3")
cell.setValue(180)
cell = cells.get("D1")
cell.setValue(40)
cell = cells.get("D2")
cell.setValue(120)
cell = cells.get("D3")
cell.setValue(250)

charts = worksheet.getCharts()

# 向工作表添加圖表
chartIndex = charts.add(ChartType.BUBBLE, 6, 2, 22, 10)
chart = charts.get(chartIndex)

# 將NSeries(圖表數據源)添加到圖表範圍從“A1”
# 細胞到“B3”
series = chart.getNSeries()
series.add("A1:B3", True)

# 設置氣泡大小
chart.getNSeries().get(0).setBubbleSizes("B2:D2")
chart.getNSeries().get(0).setXValues("B3:D3")
chart.getNSeries().get(0).setValues("B1:D1")

# 保存 Excel 文件
workbook.save("excel-bubble-chart.xlsx")
其他圖表類型
您還可以使用 Aspose.Cells for Python 以類似的方式創建其他類型的圖表。只需使用適當的聊天類型並設置特定於每種類型的附加選項。
用於在 Excel 中創建圖表的 Python 庫 - 獲取免費許可證
您可以通過獲得 免費臨時許可證 來試用 Aspose.Cells for Python 而不受評估限制。
結論
在本文中,您了解瞭如何使用 Python 在 Excel 文件中創建圖表。借助代碼示例,我們演示瞭如何使用 Python 在 Excel 中創建柱狀圖、3D 柱狀圖、餅圖和氣泡圖。更多詳細信息,您可以訪問庫的文檔。如果您有任何疑問,請通過我們的 論壇 聯繫我們。