
Excel 图表通常用于直观地表示和描述电子表格中的数据。您可以在 Excel 中创建各种图表,如折线、条形、饼图、甜甜圈、金字塔、气泡等。在本文中,您将学习如何使用 Python 在 Excel 文件中创建图表。我们将创建一些图表来演示在 Python 中以编程方式创建 Excel 图表是多么容易。
- 在 Excel 中创建图表的 Python 库 - 免费下载
- 在 Python 中创建 Excel 图表的简单步骤
- 支持的 Excel 图表类型
- 用 Python 在 Excel 中创建图表
- 在 Excel 中创建 3D 柱形图
- 在 Excel 中生成饼图
- 在 Excel 中创建气泡图
- 获得免费许可证
用于创建 Excel 图表的 Python 库 - 免费下载
为了在 Python 中使用 Excel 数据创建图表,我们将使用 Aspose.Cells for Python。它是一个功能丰富的库,可让您在 Python 应用程序中实现 Excel 自动化。此外,它还允许您无缝地创建各种图表。您可以使用以下命令将其从 PyPI 安装到您的 Python 应用程序中。
pip install aspose-cells
在 Python 中创建 Excel 图表的简单步骤
Aspose.Cells for Python 简化了在 Python 中以编程方式创建 Excel 图表的过程。以下是使用 Aspose.Cells for Python 在 Excel 中创建每种图表类型所需的基本步骤。
- 加载 Excel 文件或创建新工作簿。
- 将数据插入工作簿(如果为空)。
- 选择一个工作表并添加所需类型的图表。
- 将数据范围添加到图表。
- 将 Excel 文件保存到所需位置。
支持的 Excel 图表类型
Aspose.Cells for Python 提供了一套完整的标准图表类型。该列表包括但不限于:
- 柱子
- 柱子Stacked
- 柱子100PercentStacked
- 柱子3DClustered
- 柱子3DStacked
- 柱子3D100PercentStacked
- 柱子3D
- 酒吧
- 酒吧Stacked
- 酒吧100PercentStacked
- 酒吧3DClustered
- 酒吧3DStacked
- 酒吧3D100PercentStacked
- 线
- 线Stacked
- 线100PercentStacked
- 线WithDataMarkers
- 线StackedWithDataMarkers
- 线100PercentStackedWithDataMarkers
- 线3D
- 馅饼
- 馅饼3D
- 馅饼Pie
- 馅饼Exploded
- 馅饼3DExploded
- 馅饼Bar
- 分散
- 分散ConnectedByCurvesWithDataMarker
用 Python 在 Excel 中创建图表
现在让我们看看如何将上述步骤转换为 Python 以在 Excel 工作表中生成图表。为了演示,让我们创建一个柱形图。
- 首先,使用 Workbook 类创建一个新的 Excel 工作簿或加载现有的工作簿。
- 将所需工作表引用到对象中。
- 将数据插入工作表(如果工作表为空)。
- 使用 Worksheet.getCharts().add(type, upperLeftRow, upperLeftColumn, lowerRightRow, lowerRightColumn) 方法在工作表中创建图表。
- 通过索引到对象中获取图表的引用。
- 使用 Chart.setChartDataRange(range, bool) 方法为图表设置数据源。
- 最后,使用 Workbook.save(string) 方法保存工作簿。
以下代码示例展示了如何在 Python 中创建 Excel 图表。
import jpype
import asposecells

jpype.startJVM()
from asposecells.api import Workbook, ChartType, FileFormatType

# 创建工作簿对象
workbook = Workbook(FileFormatType.XLSX)

# 获取第一个工作表的引用并添加数据
worksheet = workbook.getWorksheets().get(0)
worksheet.getCells().get("A2").putValue("Category1")
worksheet.getCells().get("A3").putValue("Category2")
worksheet.getCells().get("A4").putValue("Category3")
worksheet.getCells().get("B1").putValue("Column1")
worksheet.getCells().get("B2").putValue(300)
worksheet.getCells().get("B3").putValue(400)
worksheet.getCells().get("B4").putValue(200)
worksheet.getCells().get("C1").putValue("Column2")
worksheet.getCells().get("C2").putValue(180)
worksheet.getCells().get("C3").putValue(240)
worksheet.getCells().get("C4").putValue(450)

# 将柱形图添加到工作表
chartIndex = worksheet.getCharts().add(ChartType.COLUMN, 6, 2, 22, 10)

# 访问新添加图表的实例
chart = worksheet.getCharts().get(chartIndex)

# 将图表数据源设置为范围“A1:B4”
chart.setChartDataRange("A1:C4", True)

# 保存 Excel 文件
workbook.save("excel-column-chart.xlsx")

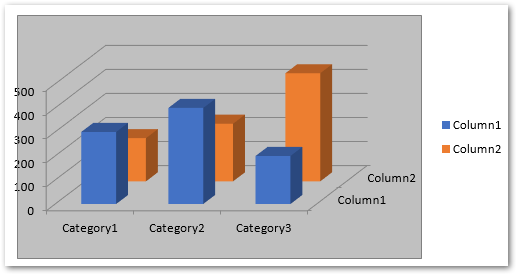
Python:在 Excel 中创建 3D 柱形图
在 Excel 中创建 3D 柱形图只需要在 Worksheet.getCharts().add() 方法中指定 ChartType.COLUMN3D 类型。其余步骤将与上一节中提到的相同。
以下代码示例显示了如何在 Python 中的 Excel 中添加 3D 柱形图。
import jpype
import asposecells

jpype.startJVM()
from asposecells.api import Workbook, ChartType, FileFormatType

# 创建工作簿对象
workbook = Workbook(FileFormatType.XLSX)

# 获取第一个工作表的引用并添加数据
worksheet = workbook.getWorksheets().get(0)
worksheet.getCells().get("A2").putValue("Category1")
worksheet.getCells().get("A3").putValue("Category2")
worksheet.getCells().get("A4").putValue("Category3")
worksheet.getCells().get("B1").putValue("Column1")
worksheet.getCells().get("B2").putValue(300)
worksheet.getCells().get("B3").putValue(400)
worksheet.getCells().get("B4").putValue(200)
worksheet.getCells().get("C1").putValue("Column2")
worksheet.getCells().get("C2").putValue(180)
worksheet.getCells().get("C3").putValue(240)
worksheet.getCells().get("C4").putValue(450)

# 将 3D 柱形图添加到工作表
chartIndex = worksheet.getCharts().add(ChartType.COLUMN_3_D, 6, 2, 22, 10)

# 访问新添加图表的实例
chart = worksheet.getCharts().get(chartIndex)

# 将图表数据源设置为范围“A1:B4”
chart.setChartDataRange("A1:C4", True)

# 保存 Excel 文件
workbook.save("excel-column3d-chart.xlsx")
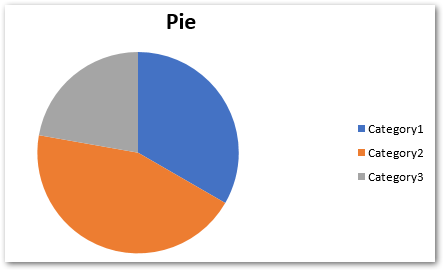
用 Python 在 Excel 中创建饼图
要创建饼图,只需在将图表添加到工作表时传递 ChartType.PIE 类型。您可以在加载 Excel 文件之前动态地将数据插入工作表或添加。
以下代码示例展示了如何在 Python 中的 Excel 中插入饼图。
import jpype
import asposecells

jpype.startJVM()
from asposecells.api import Workbook, ChartType, FileFormatType

# 创建工作簿对象
workbook = Workbook(FileFormatType.XLSX)

# 获取第一个工作表的引用并添加数据
worksheet = workbook.getWorksheets().get(0)
worksheet.getCells().get("A2").putValue("Category1")
worksheet.getCells().get("A3").putValue("Category2")
worksheet.getCells().get("A4").putValue("Category3")
worksheet.getCells().get("B1").putValue("Pie")
worksheet.getCells().get("B2").putValue(300)
worksheet.getCells().get("B3").putValue(400)
worksheet.getCells().get("B4").putValue(200)

# 将饼图添加到工作表
chartIndex = worksheet.getCharts().add(ChartType.PIE, 6, 2, 22, 10)

# 访问新添加图表的实例
chart = worksheet.getCharts().get(chartIndex)

# 将图表数据源设置为范围“A1:B4”
chart.setChartDataRange("A1:B4", True)

# 保存 Excel 文件
workbook.save("excel-pie-chart.xlsx")
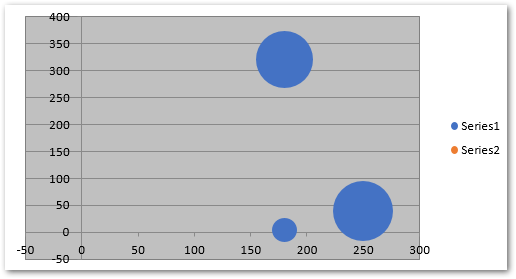
在 Excel 中创建气泡图
要在 Excel 中创建气泡图,您需要在 Worksheet.getCharts().add() 方法中传递 ChartType.BUBBLE。此外,您还必须将数据范围添加到图表系列。此外,您可以设置气泡大小和 X 和 Y 坐标值。
以下代码示例展示了如何使用 Python 在 Excel 中创建气泡图。
import jpype
import asposecells

jpype.startJVM()
from asposecells.api import Workbook, ChartType, FileFormatType

# 创建工作簿对象
workbook = Workbook(FileFormatType.XLSX)

# 获取第一个工作表的引用并添加数据
worksheet = workbook.getWorksheets().get(0)
# 向单元格添加一些样本值
cells = worksheet.getCells()
cell = cells.get("A1")
cell.setValue(50)
cell = cells.get("A2")
cell.setValue(100)
cell = cells.get("A3")
cell.setValue(150)
cell = cells.get("B1")
cell.setValue(4)
cell = cells.get("B2")
cell.setValue(20)
cell = cells.get("B3")
cell.setValue(180)
cell = cells.get("C1")
cell.setValue(320)
cell = cells.get("C2")
cell.setValue(110)
cell = cells.get("C3")
cell.setValue(180)
cell = cells.get("D1")
cell.setValue(40)
cell = cells.get("D2")
cell.setValue(120)
cell = cells.get("D3")
cell.setValue(250)

charts = worksheet.getCharts()

# 将图表添加到工作表
chartIndex = charts.add(ChartType.BUBBLE, 6, 2, 22, 10)
chart = charts.get(chartIndex)

# 将 NSeries(图表数据源)添加到图表中,范围从“A1”
# 单元格到“B3”
series = chart.getNSeries()
series.add("A1:B3", True)

# 设置气泡大小
chart.getNSeries().get(0).setBubbleSizes("B2:D2")
chart.getNSeries().get(0).setXValues("B3:D3")
chart.getNSeries().get(0).setValues("B1:D1")

# 保存 Excel 文件
workbook.save("excel-bubble-chart.xlsx")
其他图表类型
您还可以使用 Aspose.Cells for Python 以类似的方式创建其他类型的图表。只需使用适当的聊天类型并设置特定于每种类型的附加选项。
在 Excel 中创建图表的 Python 库 - 获得免费许可证
您可以通过获得 免费临时许可证 来试用 Aspose.Cells for Python,而不受评估限制。
结论
在本文中,您了解了如何使用 Python 在 Excel 文件中创建图表。在代码示例的帮助下,我们演示了如何在 Python 中的 Excel 中创建柱形图、3D 柱形图、饼图和气泡图。有关更多详细信息,您可以访问该库的文档。如果您有任何疑问,请通过我们的 论坛 联系我们。